
说明
价格预测动态 📈🔮
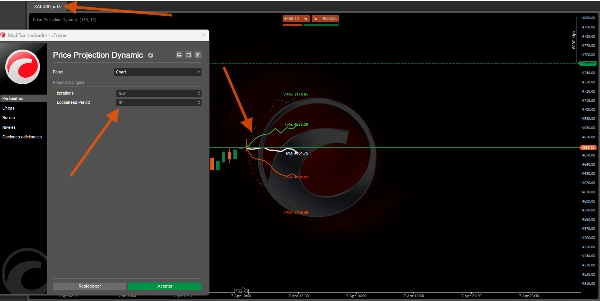
https://chartshots.spotware.com/c/69d5304ea1cc1
它是什么?
https://chartshots.spotware.com/c/69d52fb4b01cd
价格预测动态 是一个叠加指标,通过蒙特卡洛模拟投射统计上可能的未来价格路径,并通过贝叶斯概率分类器评估方向偏差。它回答了一个问题:鉴于该资产的运动情况,统计上它接下来可能会去哪里? 📊
https://chartshots.spotware.com/c/69d53010d38ce
工作原理 ⚙️
引擎 1 — 蒙特卡洛预测 🎲
该指标分析近期价格历史并提取对数收益率。它计算平均收益及其标准差——捕捉资产的漂移(趋势)和波动率(不规则波动)🌪️。
它运行200条模拟价格路径(最多500条)向未来延伸。每次模拟都是基于真实近期走势的“随机游走”。从中,指标提取了5个百分位带:
带
含义
95%
乐观极限——只有5%的模拟结果更高 🚀
75%
上部可能范围——价格在25%的模拟中高于此 📈
50% (MD)
中位数预测 — 所有结果的统计中心 🎯
25%
下部可能范围——价格在25%的模拟中低于此 📉
05%
悲观极限——只有5%的模拟结果更低 📉🛑
专业提示: 风扇越开得越宽,当前波动率越高 📢。紧密的风扇意味着资产运动可预测 🧵。
引擎 2 — 贝叶斯分类器 🧠
独立于预测,该引擎通过以下方式将市场分类为看涨或看跌:
- 回顾一个时间窗口(默认500根K线)🔍。
- 测量 相对成交量 和 动量 对比看涨与看跌K线。
- 使用高斯概率计算当前K线更符合哪个特征 ⚖️。
结果是一个胜率百分比:
概率
解释
> 70%
高度看涨信心 ✅🟢
50–70%
中等/不明确 ⚖️🟡
< 30%
高度看跌信心 ✅🔴
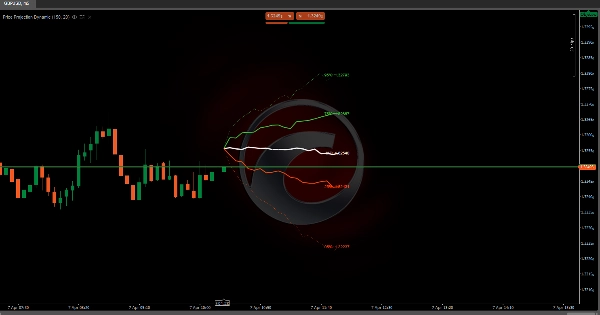
视觉元素 🎨
- 绿色线条(75%,95%): 上部预测带——看涨区间 🍏
- 白色线条(MD): 中位预测价格——最可能的路径 🏁
- 橙色线条(25%,05%): 下部预测带——看跌区间 🍊
- 虚线外部线条: 95%和05%极限(低概率边界)⚠️
- 实线内部线条: 75%,50%,25%(高概率区间)✅
- 价格标签: 每个百分位的精确预测价格 🏷️
- 信息面板(右上角): 贝叶斯胜率,中位目标,相对成交量,信号方向 🖥️
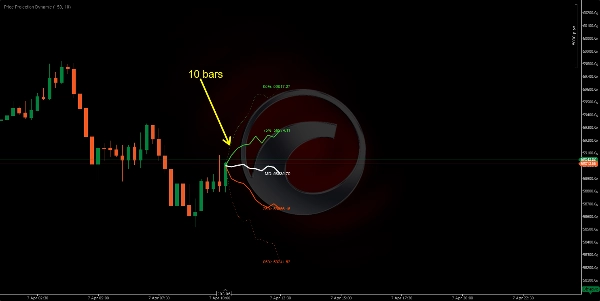
使用方法 📖
- 观察风扇形状 📢 — 如果迅速展开,波动率高,预测不确定性大。
- 使用中位线(MD) 🎯 作为最统计可能的未来价格目标。
- 使用75%/25%带 📏 作为交易的现实上下目标。
- 使用95%/05%带 🛑 作为极限边界——适合设置止损。
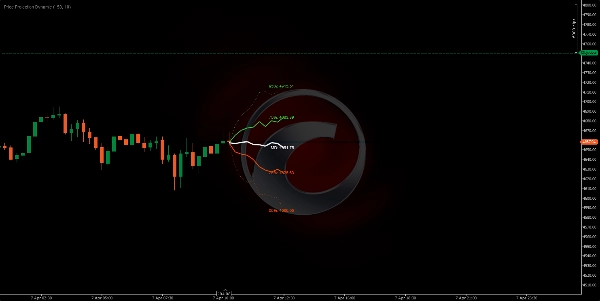
- 查看贝叶斯面板 🧠 — 概率高于70%或低于30%增加方向信心。
- 结合两个引擎 🤝 — 如果中位线向上倾斜 且 贝叶斯概率>70%,则设置统计上强劲。
关键参数 ⚙️
参数
控制内容
较高数值
较低数值
迭代次数
模拟路径数量
更平滑的带 🌊
更快的计算 ⚡
前瞻距离
未来预测距离
更长的时间视野 🔭
更短且更可靠 🔍
样本深度
分析的近期K线数量
长期行为 🐢
仅近期行为 🐇
分类器窗口
贝叶斯历史
更稳定的概率 ⚖️
更灵敏 ⚡
指标简介 📋
- 指标类别: 统计 📊
- 输出类型: 可视化与信号 🖼️
- 数据需求: 仅K线 📶
免责声明 ⚠️
该指标预测的是统计概率,而非确定性预测 🔮。蒙特卡洛模拟假设未来将类似近期过去——但在黑天鹅事件 🦢或新闻驱动的跳空时此假设失效。请将其作为概率框架,结合您自己的风险管理使用 🛡️。
摘要
客户评价
5 | 0 % | |
4 | 100 % | |
3 | 0 % | |
2 | 0 % | |
1 | 0 % |


