

说明
Smart Money Suite Pro — cTrader 的完整机构价格行为工具包
如果您使用智能资金概念或任何基于机构订单流的价格行为方法进行交易,您就会知道痛点:图表上散布着十几个指标,每个指标只完成部分工作,彼此之间没有任何联系。Smart Money Suite Pro 的诞生就是为了解决这个问题。
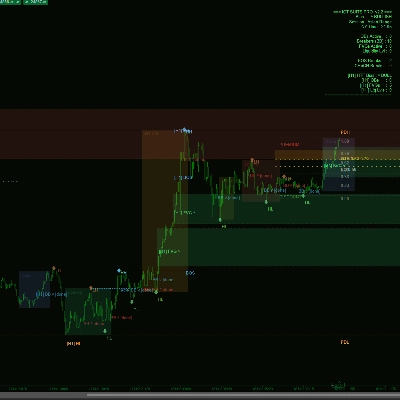
这是一个单一的、自包含的指标,涵盖了机构价格行为和智能资金方法中的每一个主要概念——专为 cTrader 从零设计,优化以在实时图表上平稳运行且无闪烁,并配备了提升使用体验的功能,使其在真实交易中真正可用。
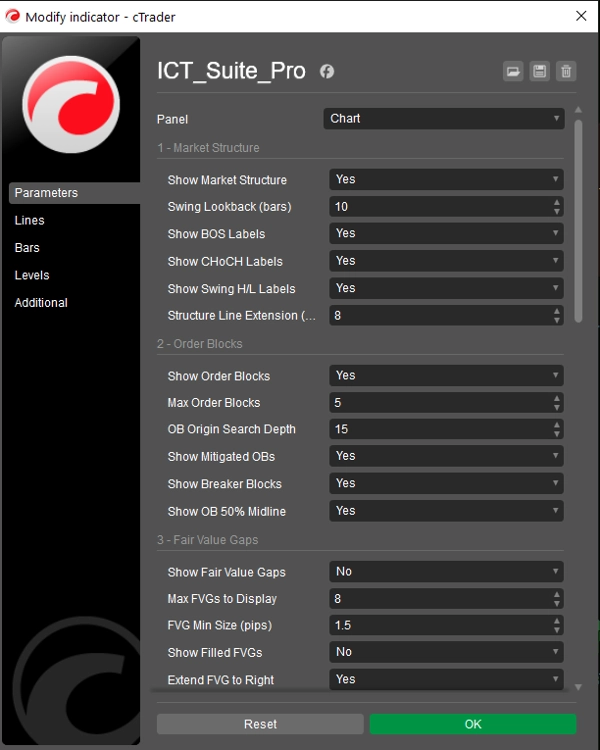
市场结构 — 自动且精准
该指标持续扫描您的图表,确认摆动高点和低点,将每个点分类为更高高点、更低高点、更高低点或更低低点。每一次结构突破(BOS)和特征变化(CHoCH)都会被检测并用虚线水平线标记,您可以准确看到价格突破了之前的结构。BOS(趋势延续)和 CHoCH(趋势反转)之间的区别通过颜色编码,使其一目了然。摆动回溯深度完全可调。
订单区块 — 全生命周期跟踪
订单区块通过定位每次冲击波前的最后一个相反方向的蜡烛来识别,该冲击波导致了确认的摆动。每个区块以彩色框绘制,延伸至图表右侧,您可以一眼看出价格是否回到了该区域。当订单区块被缓解时,矩形被移除并替换为淡淡的文本标记——保持图表整洁,同时保留该水平的记录。当价格随后突破已缓解订单区块的另一侧时,它被重新分类为突破区块并重新着色,标志着潜在的反转区域。每个活动区块内部绘制了 50% 中线,以突出显示区域内的溢价/折扣分界线。
公平价值缺口 — 跟踪至填补
在整个回溯窗口中,检测双向的三蜡烛价格不平衡。每个缺口通过可配置的最小点数过滤以消除噪音。未填补的缺口延伸至图表右侧,直到价格回归填补为止,届时根据您的设置,它们要么被移除,要么标记为已填补。多头和空头不平衡同时处理。
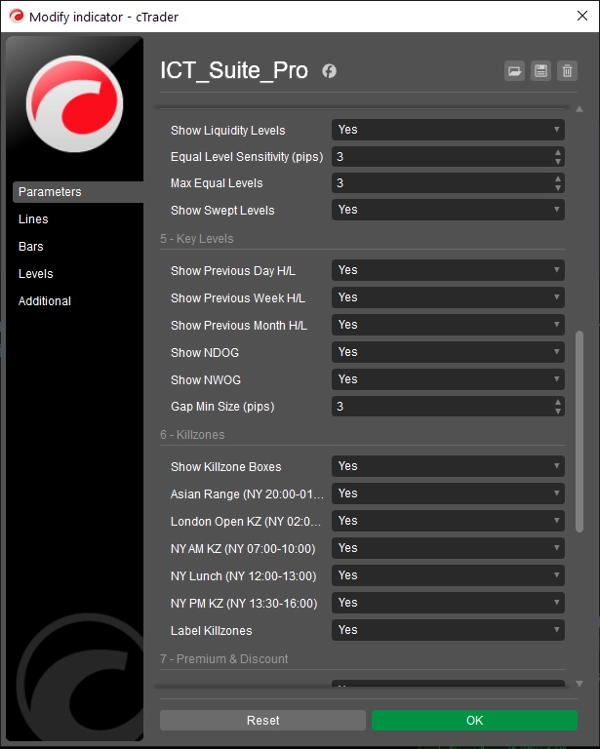
流动性水平 — 等高点和等低点
该指标扫描位于可配置点数容差范围内的摆动高点或摆动低点簇——识别机构订单流倾向于瞄准的买方和卖方流动性池。每个水平在两个摆动点处绘制刻度标记,并向右投射虚线。一旦价格扫过流动性水平,根据您的偏好,该水平要么被隐藏,要么被标记为已扫过。
关键水平 — 前一天、前一周和前一月
前一天高点/低点、前一周高点/低点和前一月高点/低点自动从您的图表价格数据计算得出。所有日期边界均基于经纪商的条形时间戳——而非您的本地系统时钟——因此无论您的时区或工具换月如何,均保持准确。每对水平使用不同颜色和线型,确保在图表上清晰分层。
开盘缺口 — 日线和周线
该指标扫描每个日线和周线开盘价与前一交易时段收盘价之间的价格缺口。任何超过您定义的最小点数的缺口都会以彩色矩形绘制。新日开盘缺口和新周开盘缺口通过不同颜色区分,帮助您即时识别哪些缺口尚未填补。
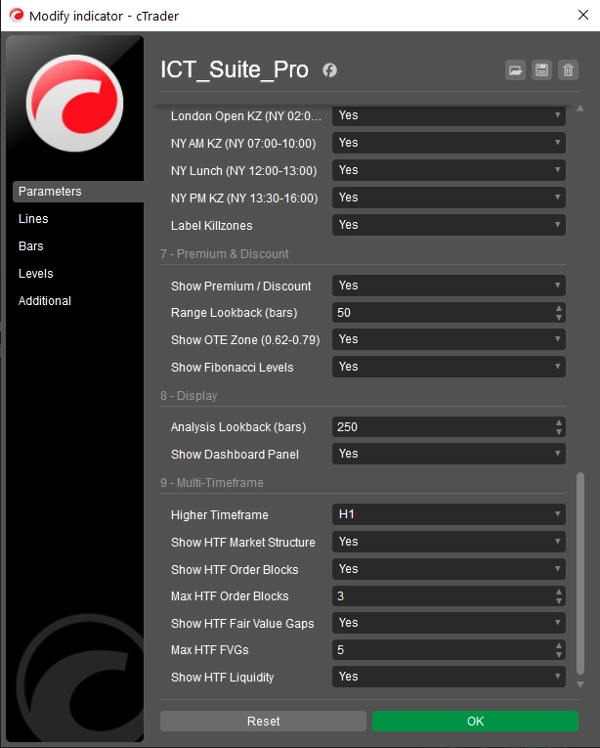
交易时段关键区 — 真实区间框
亚洲时段、伦敦开盘、纽约上午、纽约午盘和纽约下午交易时段窗口以填充框绘制,覆盖每个时段内形成的实际高低价区间。时间基于纽约时间,并自动调整 EDT/EST 夏令时。每个框可单独切换和标记。由于这些框反映的是实际价格区间而非固定垂直线,您可以立即看到每个时段的活跃程度及价格达到的极值。
溢价与折扣区 — 最优入场区间
滚动区间分析计算可配置回溯期内的最高高点和最低低点。基于此区间,指标绘制均衡点(0.50)、最优入场区间(0.62–0.79 斐波那契)以及全套关键斐波那契回撤水平。溢价和折扣标签置于区间内,方便您随时了解当前交易区间价格处于哪一半。回溯期自动限制为与您可见的条形窗口匹配,因此不会引用您看不到的条形。
多时间框架叠加 — 突出功能
MTF 系统通过将当前图表的条形聚合到时间对齐的槽中,重建更高时间框架的蜡烛图——无需单独的数据订阅。从下拉菜单选择更高时间框架(M5、M15、M30、H1、H4、D1),Smart Money Suite Pro 将直接在当前图表上计算并绘制更高时间框架的订单区块、公平价值缺口、市场结构和流动性水平。更高时间框架的项目视觉上区别明显:边框更粗、轮廓虚线、标签前缀带时间框架标记(例如 [H4] OB ^),让您始终清楚某个水平属于哪个时间框架。
如果您选择的更高时间框架等于或低于当前图表时间框架——这是不可能的配置——指标会在屏幕上显示明确警告且不绘制任何内容,防止出现误导性数据。
当叠加激活时,仪表板面板会更新,增加专门的更高时间框架部分,显示 HTF 偏向、活跃订单区块数量、公平价值缺口数量和流动性水平数量,辅以当前时间框架的汇总信息。
实时仪表板
一个简洁的右侧固定面板显示:当前市场偏向、活跃交易时段、纽约时间、所有活跃订单区块、突破区块、公平价值缺口和流动性水平的计数,以及回溯窗口内检测到的 BOS 和 CHoCH 突破总数。当启用多时间框架叠加时,更高时间框架汇总会自动附加显示在下方。
为实时交易而建
该指标仅在新条形形成时重绘——而非每个新报价都重绘——消除了许多一体化指标常见的图表闪烁。所有分析均在可配置的回溯窗口内运行,因此即使在低时间框架且条形数量较多时,性能也保持稳定。


!["[Hamster-Coder] Pivot Points MTF" 标识](https://cdn.ctrader.com/image/webp/4c143e5a-309c-40e3-a578-f04d1e133ffa_31159)


