
说明
大多数趋势指标以相同的方式回答相同的问题:平滑价格,画几条线,寻找交叉点。FDQ价格通道围绕一个不同的问题构建——价格实际上在做什么,剔除噪音和漂移,这告诉你价格可能会走向何方?
其结果是一个基于通道的趋势指标,将三个不同的分析层合并为一个可读的叠加层。
- 关键点
不同的起点。大多数指标使用的价格序列在统计学上是个问题。
原始价格包含随机游走成分,掩盖了有意义的结构。在绘制任何通道之前,FDQ应用了分数阶微分变换——一种借鉴自量化研究的技术——去除这种漂移,同时有意保留数据中的长程记忆。剩下的是一个变换后的序列,仍然反映市场的历史,但不再被当前价格主导。这是一切构建的基础。
- 噪音有代价
每种基于滞后的平滑方法都以牺牲时机换取准确性。卡尔曼滤波则不然。
卡尔曼滤波是一种递归估计过程:它不断更新对市场的看法,平衡对新数据的信任程度与已有信息的权重。与移动平均不同,它没有固定的回溯窗口,也不对所有过去的柱子一视同仁。输出是价格的更清晰表示,能快速响应真实的变动,抵抗对噪音的反应——没有平滑通常带来的信号延迟。
- 基于行为而非公式构建的带状区间
标准差带假设价格服从正态分布,但实际很少如此。
FDQ通道边界使用分位数分析定义——变换价格在回溯期内的实际统计分布。高带标记序列在其范围上极端真正达到的水平;低带则在下极端做同样标记。这些不是从均值计算的理论边界,而是反映价格实际交易位置,使其对市场在任何时刻的真实行为更为敏感。
- 通道内的第二层
外层带定义范围,内层带定义区域。
第二组带状区间按比例位于外层通道与中线之间。这个内层层次创建了一个独特的交易区域——比整个通道更窄,基于相同的统计基础——作为入场和信号分类的分级参考。
- 趋势状态优先于一切
没有上下文的信号只是随机数据。
该指标持续跟踪通道的方向状态,采用三带成分的多数投票机制。当至少两个带同时朝同一方向移动时,趋势状态被确认是上升或下降。信号仅在与当前状态一致时生成——上升状态下仅生成多头设置,下降状态下仅生成空头设置。当市场未达到此阈值时,不声明状态且不生成信号。状态间的转换以垂直线直接标记在图表上。
- 三种不同的反弹设置
并非所有回调都相同。指标识别三种等级。
一旦趋势状态激活,指标会观察特定的反弹模式——价格逆势移动,触及定义的水平,然后反转穿过该水平的时刻。
-
- 中度反弹 — 价格跌破(或升破)通道中线后回升。趋势内的标准回调。
- 深度反弹— 价格进一步延伸,达到内层带极限后回升。更坚定的回调,伴随更果断的反转。
- 轻度反弹— 价格触及趋势一侧的内层带后迅速反弹。三者中最浅,发生频率最高。
每种类型在图表上视觉上均有区别,可独立启用或禁用。
- 你所看到的
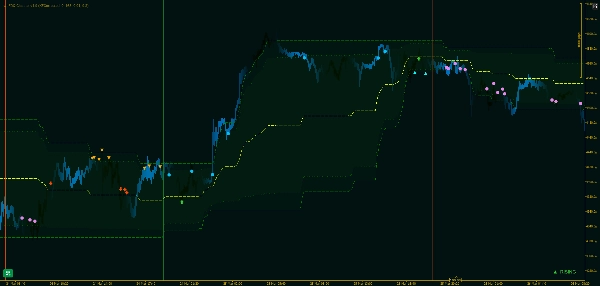
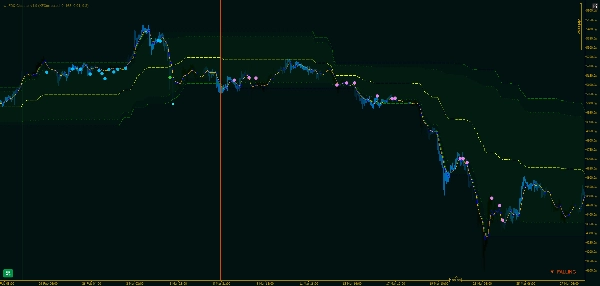
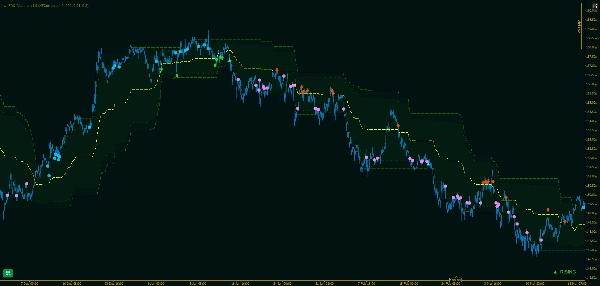
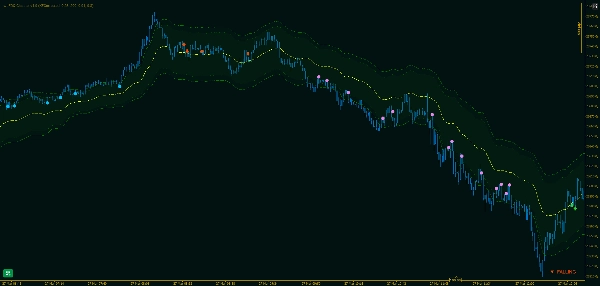
图表直接讲述故事,无需解释。
主通道、内层带和中线以连续线覆盖价格。状态转换以垂直线标记——绿色表示上升,红色表示下降——趋势状态变化的历史一目了然。信号标记出现在每次反弹确认的柱子上,针对每种信号类型和方向有不同图标。
- 为何此方法有效
大多数通道指标在市场快速移动时滞后,市场不动时反应过度。
由于FDQ通道基于一个平稳且保留记忆的变换,而非滚动平均,带状区间根据实际行为分布调整,而非追逐价格。卡尔曼层保持基础估计的清晰,无需窗口平滑带来的时机成本。结果是一个在不同市场条件下——趋势、震荡和过渡——都保持有效的通道,无需手动调整。
摘要
The channel boundaries are defined by quantile analysis of the transformed price distribution rather than standard deviation, capturing actual price extremes over the lookback period. It features outer bands marking the full range and inner bands creating a narrower trading zone for refined entry signals. The indicator continuously tracks trend direction using a majority vote across three band components, confirming Rising or Falling states and marking transitions with vertical lines on the chart.
Within active trends, wt.FDQ Channel identifies three distinct rebound setups—Light, Mid, and Deep—each representing different pullback intensities and reversal confirmations. These signals are visually distinct and configurable. The overlay displays the primary channel, inner bands, midline, trend states, and rebound signals directly on the price chart, supporting analysis across various markets including Forex, indices, and cryptocurrencies.
客户评价
5 | 100 % | |
4 | 0 % | |
3 | 0 % | |
2 | 0 % | |
1 | 0 % |


