
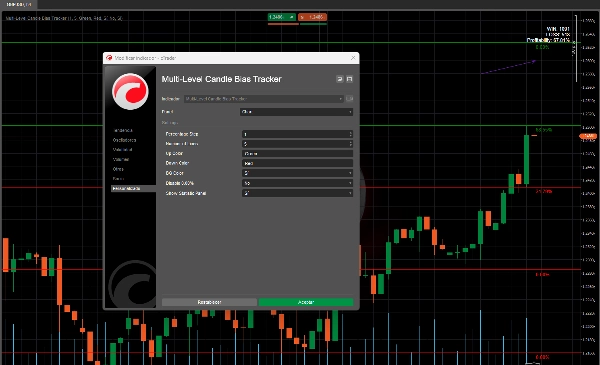
Multi-Level Candle Bias Tracker
指标
877 下载
版本 1.0, Jan 2025
Windows 版、Mac 版
5.0
评价:1
说明
Pinescriptlabs 商店指标: Pinescriptlabs 商店 cBots : (cBot) Gold & BTC 突破会话枢轴(新)
智能追踪算法 (新)
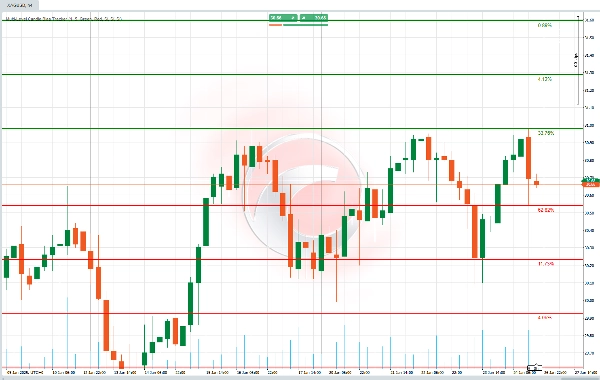
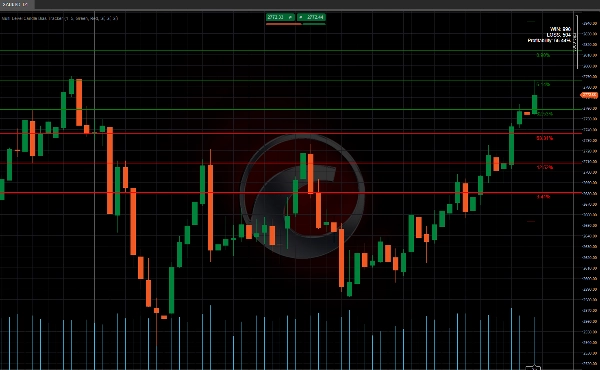
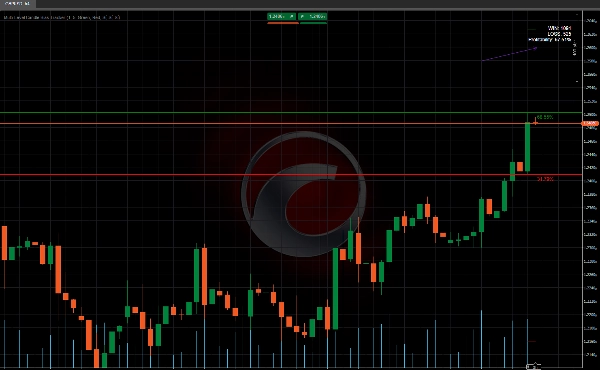
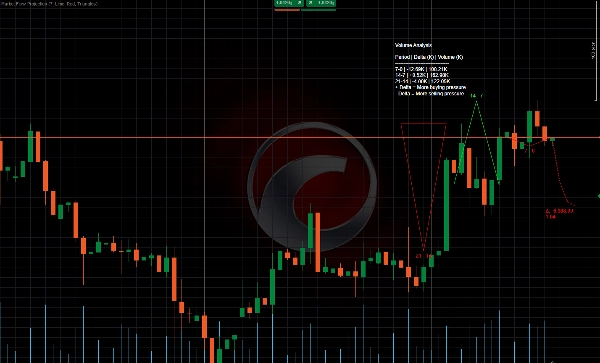
该算法 确定价格达到新高或新低的可能性,并将其表示为图表上的一个水平线,同时显示相应的百分比。此计算经过回测,结果以表格形式展示,便于理解下一根蜡烛创出新高或新低的概率。📈📉
它是如何工作的? 🛠️
- 新高和新低的概率 🎯
-
- 算法分析过去的价格行为,以计算价格在下一根蜡烛中创出 新高或新低的概率。
- 例如,如果新高的概率为 70%,则价格更可能上涨。⬆️
- 带百分比的水平线 📏
-
- 它在图表上绘制表示关键水平的水平线,并附带一个百分比,表示价格达到该水平的概率。
- 这些水平是根据您定义的 百分比(例如 1%)计算的。
- 统计面板 📊
-
- 它显示价格达到这些水平的次数(成功次数)以及未达到的次数。
- 它还提供一个 有效性百分比,告诉您这些水平在过去是否可靠。✅❌
它的用途是什么?
- 了解价格方向:帮助您知道下一根蜡烛价格更可能上涨还是下跌。⬆️⬇️
- 管理风险:如果某个水平概率较低,您可以避免该水平以减少风险决策。
您如何使用它?
- 观察水平线:查看算法在图表上绘制的线条。👀
- 检查概率:如果某个水平概率较高(例如 70%),价格更可能达到该水平。📈
- 使用统计面板:查看这些水平过去的表现,以决定是否信任它们。📊
摘要
AI 摘要
The Multi-Level Candle Bias Tracker is an indicator that calculates the probability of the price reaching a new high or low in the next candle. It analyzes past price behavior to determine these probabilities and displays them as horizontal levels on the chart, each accompanied by a percentage indicating the likelihood of the price reaching that level. Users can define the percentage threshold for these levels (e.g., 1%).
The indicator includes a statistics panel that shows how many times the price has successfully reached these levels versus how many times it has not, along with an effectiveness percentage reflecting the reliability of these levels based on historical data.
This tool is designed to help traders understand the likely direction of price movement in the next candle and manage risk by avoiding levels with low probabilities. Users apply it by observing the drawn levels, checking their associated probabilities, and reviewing the statistics panel to assess the historical performance of these signals.
Supported markets include commodities, cryptocurrencies (e.g., BTCUSD), and other symbols. The indicator integrates probability-based analysis into price action trading to assist in decision-making regarding potential breakout or trend continuation scenarios.
指标配置
客户评价
5.0
评价:1
5 | 100 % | |
4 | 0 % | |
3 | 0 % | |
2 | 0 % | |
1 | 0 % |
客户评价
July 14, 2025
Pros: Visualizes candle bias across multiple timeframes. Clean interface, helpful for multi-TF trend confirmation. Cons: No alerts or tooltips. Bias logic is basic. Lacks template saving and signal confirmation features.
讨论
常见问答
BTCUSD
Breakout
Supertrend
Commodities
RSI
Crypto
XAUUSD
cTrader Store 提供的所有产品,包括交易机器人、指标和插件,均由第三方开发者提供,仅供信息参考和技术访问之用。cTrader Store 并非经纪商,不提供投资建议、个人推荐或任何未来业绩保证。


价格
注册日期 03/10/2024
163
销售
38.56K
免费安装