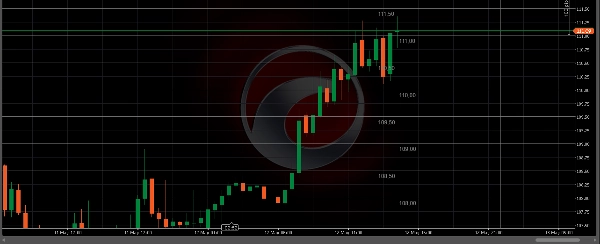
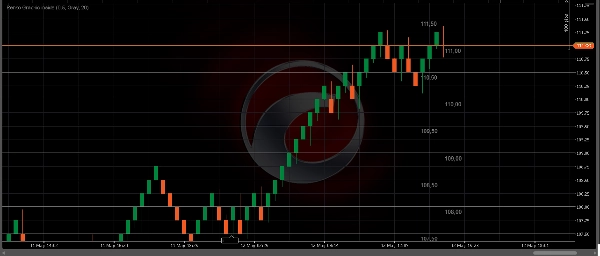
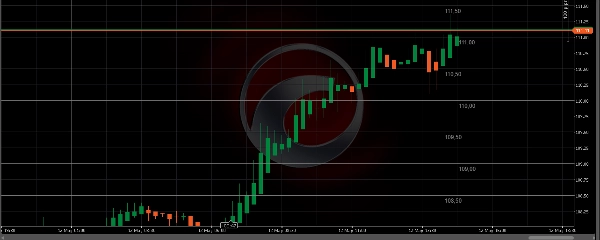
"Multi-Level Grid Overlay" 标识
指标
版本 1.0, May 2026
Windows 版、Mac 版
"Multi-Level Grid Overlay" 已上传图片
注册日期 22/02/2026

This custom indicator draws configurable horizontal grid lines on any chart type (Renko, Candlestick, Line, Tick, Range, Volume, Point & Figure, and Kagi). It helps traders visualize higher timeframe brick levels directly on their lower timeframe chart, supporting multi-timeframe analysis without switching between windows.


KEY FEATURES:

- Works with ALL chart types (Renko, Candles, Line, Tick, Range, Volume, PnF, Kagi)

- Configurable grid spacing (from 0.1 points upward)

- Adjustable number of grid lines (4 to 50)

- Customizable line colors for better visibility

- Automatic price level labels for quick reference


TRADING USE CASES:

- Identify support and resistance levels

- Perform multi-timeframe analysis on a single chart

- Visualize "higher brick" boundaries on lower Renko charts

- Spot key price zones for entries and exits


TECHNICAL DETAILS:

- Indicator type: Visual overlay / Grid lines

- Works on: All timeframes (the grid spacing is price-based, not time-based)

- Compatible with: Forex, Indices, Commodities, Crypto, Stocks


⚠️ DISCLAIMER: Trading involves risk of loss. Past performance does not guarantee future results. This indicator is a visual tool and does not generate trading signals. Always use proper risk management.


SUPPORT:

For questions or feature requests, contact the developer through the cTrader Store.


HOW TO USE:

Simply attach the indicator to any chart and adjust the "Higher Renko Size" parameter to set the grid spacing. The number of lines and colors are fully customizable.

指标配置
指标分类
市场结构(SMC)
输出类型
可视化
数据要求
仅 K 线
0.0
评价:0
客户评价
该产品尚无评价。已经试过了?抢先告诉其他人!
Key Levels
Support & Resistance
cTrader Store 提供的所有产品,包括交易机器人、指标和插件,均由第三方开发者提供,仅供信息参考和技术访问之用。cTrader Store 并非经纪商,不提供投资建议、个人推荐或任何未来业绩保证。

该作者的其他作品

指标
Volume
Key Levels
+4
Session & Kill Zone Highlighter - Visual tool for London, NY, Tokyo, Sydney sessions plus ICT Kill Zones.
指标
ADX
ATR
+5
Signal Quality Score - 0-100 filter combining RSI, Volume, ATR, Trend Strength & Alignment. Works on ANY chart type.
指标
ADX
ATR
+5
Identifies TRENDING, RANGING and VOLATILE markets with pullback detection. Anti-noise filter. Works on ANY chart.

猜您喜欢

指标
Auto-detect supply & demand zones, remove broken levels, and trade smarter with real-time alerts. Precision made simple.
指标
ATR
Support & Resistance
Price information (D/W/M range) + ATR + swap calculator with triple swap detection. Price GPS.
指标
SMC
Prop
+6
Automatically draws the Opening Range (High & Low) for Tokyo, London, and New York sessions. Configurable start times,
指标
Prop
Forex
+7
Heatmap of intra-HTF volume (POC/VA) built from LTF tick data; paints current candle and auto-loads visible history.
指标
BOS
Volume
+5
Stop guessing. Use Institutional Level 2 Depth Of Market Data to make informed decisions on the direction of the markets
指标
RSI
VWAP
+8
📈 Anchored VWAP with auto High/Low, session resets, Daily VWAP & TWAP — precise, Pine-accurate port.
指标
Prop
Forex
+13
🐠 Coral Filter X Pro turns trend detection into a simple, repeatable workflow 🐠
指标
AI
ATR
+27
Smart Money Gaps: MTF FVG auto-detection, extension, and mitigation marker. Trade institutional imbalances.
指标
SMC
Prop
+4
📈 Trading Sessions Indicator — London, New York & Tokyo Visualize Key Market Sessions + High/Low Levels with Precision
指标
AI
ATR
+13
Liquidity Pressure Index is a tool that gives traders deeper insights into the hidden dynamics of market liquidity
指标
ATR
MACD
+15
Professional trading indicator: 5 cloud types, 9 ML engines, SMC Order Blocks, Pandas-TA & live dashboard.
指标
Flag
Key Levels
+5
Zig Zag filters out minor price noise and connects only the most significant swing and lows for key turning points.
指标
Signal
Fractal Arrow Buy and Sell Indicator
指标
Supertrend
Liquidity Grab
+1
Auto Detect Session Indicator Trend for Intraday Trading
指标
Visually master the Inside Bar strategy with clear breakout signals and professional chart highlighting 📈🔔📉
指标
ATR
The Tenkan-ATR Indicator is a powerful and innovative indicator for Traders. SALE OFF!!!
指标
VWAP
Moving Average
Vwap Bands it is highly sought after by professional traders because it includes Standard Deviation Bands
指标
ATR
VWAP
+17
Hybrid adaptive trend filter with clean Buy/Sell signals, dynamic bands and zero-repaint analysis.
注册日期 22/02/2026