说明
摆动检测器
结构性摆动点 + 斐波那契回撤 + RSI
--------------------------------------------------
免费指标
识别结构性摆动。观察趋势。结合多重因素进行交易。
--------------------------------------------------
该指标的功能
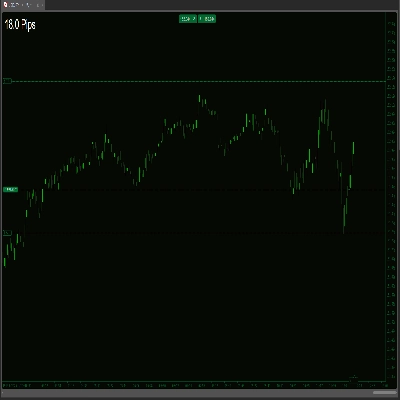
摆动检测器通过可配置深度和自动偏差过滤,使用局部极值检测识别结构性摆动高点和低点。
然后将摆动点用趋势线连接,叠加标准斐波那契回撤水平,并在价格附近显示当前RSI值。
--------------------------------------------------
主要特点
- 摆动点检测(可配置深度)
- 自动偏差:基于ATR的过滤适应任何时间框架
- 固定点差偏差模式(用于手动控制)
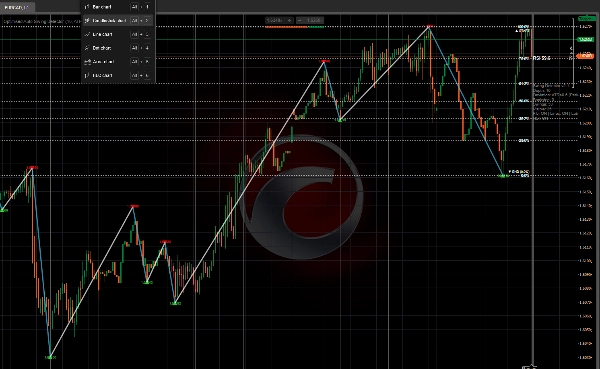
- 摆动趋势线(上涨蓝色,下跌橙色)
- 斐波那契回撤(0,23.6,38.2,50,61.8,78.6,100百分比)
- RSI值叠加(价格附近显示当前RSI)
- 可自定义颜色
- 性能优化(最大绘制柱数)
--------------------------------------------------
自动偏差 - 关键功能
提供两种偏差模式:
- 固定点差:设置摆动之间的固定最小点差距离
- 基于ATR(自动):基于当前波动性的动态偏差
自动偏差的重要性:
- M1到M5:紧密偏差(捕捉小摆动)
- H1到H4:中等偏差(捕捉结构)
- D1到MN1:宽偏差(捕捉主要摆动)
该指标会自动适应您使用的时间框架。切换图表时无需手动调整。
这使得摆动检测器可用于所有时间框架——从1分钟到月线图表。
--------------------------------------------------
斐波那契回撤 - 关键功能
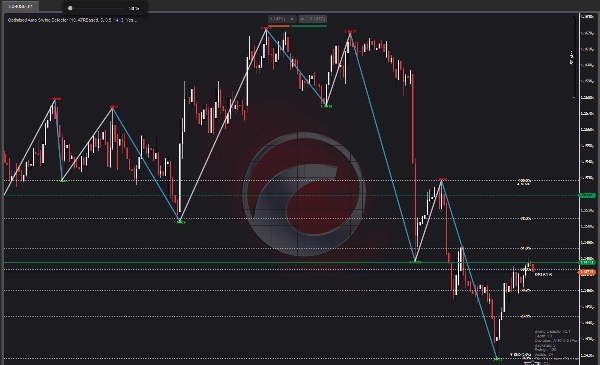
对于最后完成的摆动,指标绘制:
- 0.0百分比(摆动起点)
- 23.6百分比
- 38.2百分比
- 50.0百分比
- 61.8百分比
- 78.6百分比
- 100.0百分比(摆动终点)
切换线条和标签的显示。所有级别均采用颜色编码,便于快速视觉识别。
--------------------------------------------------
RSI叠加 - 关键功能
当前RSI值显示在价格附近,并采用颜色编码:
- 红色:RSI高于70(超买)
- 绿色:RSI低于30(超卖)
- 白色:RSI在30到70之间(中性)
这提供了即时的动量背景,无需打开单独的RSI窗口。
--------------------------------------------------
视觉元素
- 红色向下箭头 = 摆动高点
- 绿色向上箭头 = 摆动低点
- 蓝色线条 = 上升摆动(低点到高点)
- 橙色线条 = 下降摆动(高点到低点)
- 金色水平线 = 斐波那契水平
- 白色标签 = 斐波那契百分比
- RSI值 = 价格附近的当前RSI
- 信息面板 = 深度、偏差、回溯步数、摆动计数
--------------------------------------------------
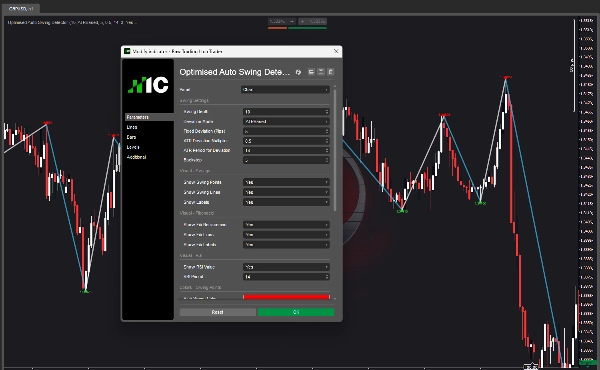
参数概览
摆动设置:
- 摆动深度:检查局部极值的柱数
- 偏差模式:固定点差或基于ATR(自动)
- 固定偏差:摆动之间的最小点差距离
- ATR偏差乘数:基于ATR偏差的乘数
- ATR周期:ATR计算周期
- 回溯步数:摆动之间的最小柱数
视觉 - 摆动:
- 显示摆动点:切换箭头显示
- 显示摆动线:切换趋势线显示
- 显示标签:切换价格标签显示
视觉 - 斐波那契:
- 显示斐波那契回撤:切换斐波那契叠加显示
- 显示斐波那契线:切换水平线显示
- 显示斐波那契标签:切换百分比标签显示
视觉 - RSI:
- 显示RSI值:切换RSI叠加显示
- RSI周期:RSI计算周期
颜色:
- 高摆动颜色
- 低摆动颜色
- 上升摆动线颜色
- 下降摆动线颜色
- 斐波那契线颜色
- 斐波那契文本颜色
- RSI标签颜色
性能:
- 最大绘制柱数:限制绘制数量以提升性能
--------------------------------------------------
使用案例
- 识别任何时间框架上的结构性摆动点
- 在摆动点之间绘制趋势线
- 使用斐波那契水平进行入场、出场和利润目标
- 通过RSI多重确认交易
- 一目了然地理解市场结构
- 切换时间框架无需调整参数(自动偏差)
--------------------------------------------------
时间框架适用性
启用自动偏差后,指标适用于:
- M1,M5,M15(剥头皮交易)
- M30,H1,H4(日内交易)
- D1(摆动交易)
- W1,MN1(持仓交易)
一个指标,适用于所有时间框架。
--------------------------------------------------
升级到结构热区
这个免费指标向您展示摆动和结构。
结构热区更进一步——它映射参与强度、接受与拒绝,以及多个区域的市场参与度。
在cTrader商店搜索“结构热区”。
--------------------------------------------------
升级到Invictus EA
Invictus EA使用相同的结构技术执行自动交易。
在cTrader商店搜索“Invictus”。
--------------------------------------------------
技术说明
- 叠加指标
- 适用于任何时间框架和品种
- 无重绘(摆动为历史数据)
- 性能优化
--------------------------------------------------
支持
包含终身更新。
欲了解更多信息 - 点击下方开发者资料。
摘要
客户评价
5 | 100 % | |
4 | 0 % | |
3 | 0 % | |
2 | 0 % | |
1 | 0 % |


!["[Hamster-Coder] Moving Average MTF" 标识](https://cdn.ctrader.com/image/webp/b11b98b1-194d-4b8e-b00e-d611826ad159_31226)