
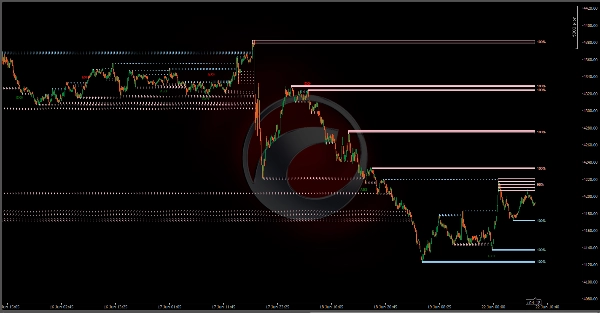
说明
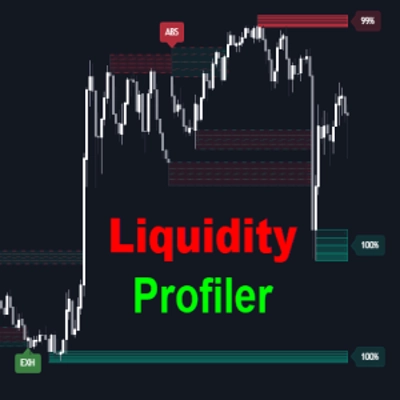
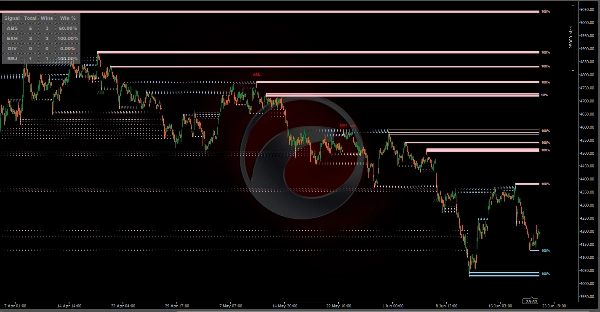
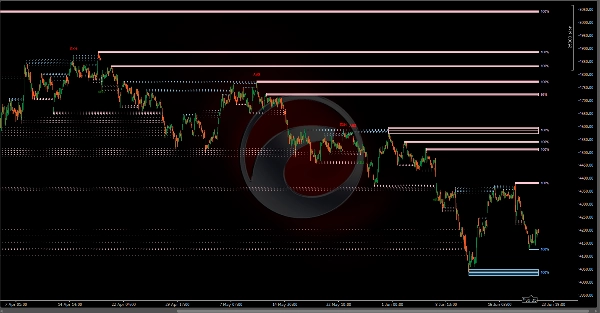
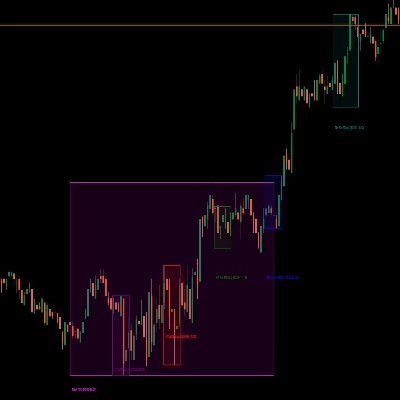
Liquidity Profiler 工具是一个指标,用于识别主要的买方和卖方流动性水平,并通过成交量差额填充的象限可视化内部买卖活动,提供完整的工具包用于分析流动性扫荡和潜在反转。
检测
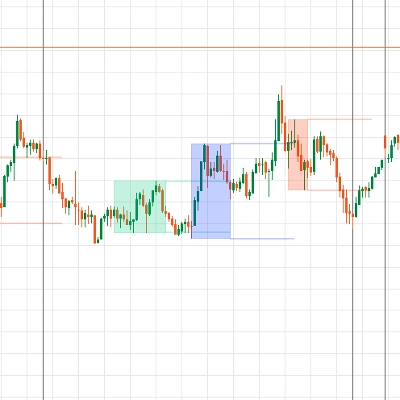
该指标利用基于枢轴点的检测系统。当确认一个摆动高点时,创建一个买方流动性(BSL)区域;摆动低点则创建一个卖方流动性(SSL)区域。脚本包含“过滤重叠”逻辑以确保图表清晰。如果在现有活动区域范围内形成一个新的、更重要的枢轴点,工具可以自动更新到最相关的水平,防止多个重叠框的混乱。
该工具将每个区域分成四个水平象限。当价格在这些象限内交易时,脚本计算每个特定部分的成交量差额(买卖压力的差异)。
买区:表示该特定价格区间内激进买家更为活跃。
卖区:表示该区间内激进卖家占主导。
反转检测
脚本包含一个检测系统,用于识别流动性扫荡期间的不寻常成交量模式。这些信号以文本形式显示如下:
-
- ABS (吸收):当区域极端边缘的激进市价单被对方向的大限价单吸收时发生。
- EXH (耗尽):当扫荡发生在非常低的相对成交量时,表明没有后续动作。
- DIV (背离):当高成交量推动至区域边缘(FOMO)但价格未能收盘在该水平之外时识别。
- REJ (回弹拒绝):当扫荡蜡烛显示与扫荡方向相反的高差额并收盘回到区域内时触发。
仪表盘:
该指标包含一个实时仪表盘,使用基于时间的验证逻辑跟踪每种反转信号类型的历史表现。
如果在评估窗口内,价格从扫荡反转并在信号入场的正确方向上连续保持盈利(保持时间)一定数量的K线,则记录为胜利。
区域衰减(健康度):
活动区域带有“健康度”百分比标签。该标签跟踪区域内成交量相对于其容量的累计交易量。随着这些水平成交量的增加,流动性被视为“消耗”,百分比逐渐下降至0%。
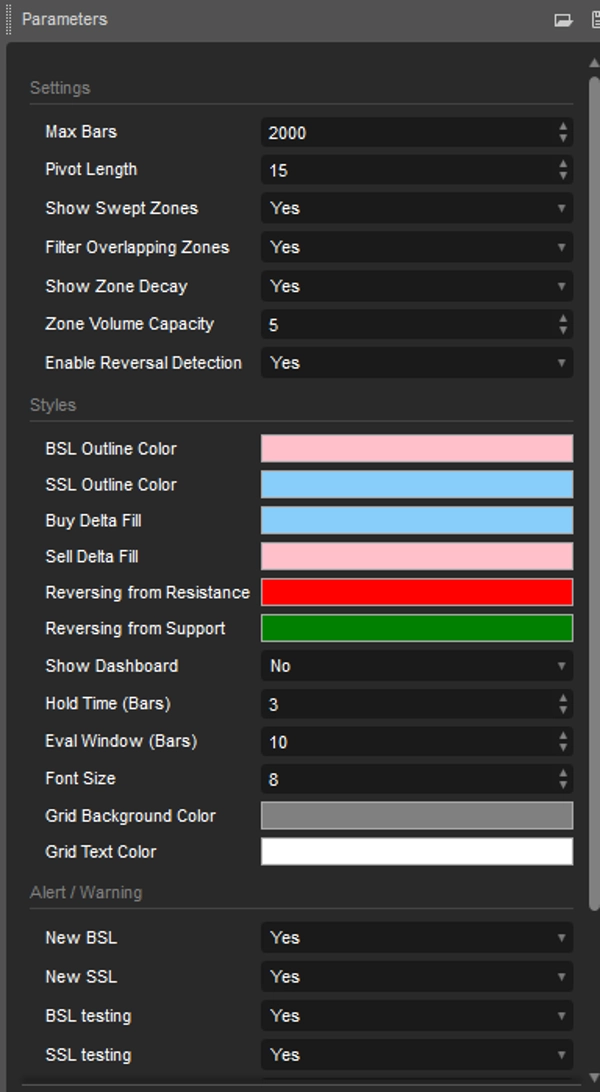
指标设置
主要设置
- 枢轴长度:检测摆动高低点的回顾/前瞻周期。
- 最大K线数:指标基于历史K线数量开始计算。
- 显示已扫荡区域:在区域被突破后保持区域以虚线轮廓可见。
- 过滤重叠区域:防止创建与现有活动区域重叠的新区域。
衰减与反转
- 显示区域衰减:切换健康度百分比标签。
- 区域成交量容量:平均成交量的乘数,用于确定区域可吸收的成交量。
- 启用反转检测:切换反转模式的信号气泡。
仪表盘
- 显示仪表盘:切换性能跟踪表。
- 保持时间(K线):价格必须连续保持盈利的K线数量,才被视为成功反转。
- 评估窗口(K线):脚本等待反转显现的最大K线数量。
样式与警报
- 样式:调整对象颜色配置。隐藏/显示仪表盘。
- 警报:在检测/迁移/测试/反转BSL和SSL时开启或关闭警报。
摘要
AI 摘要
Liquidity Profiler Tools is a trading indicator designed to identify key buy-side and sell-side liquidity levels using a pivot-based detection system. It marks Buy-Side Liquidity (BSL) zones at confirmed swing highs and Sell-Side Liquidity (SSL) zones at swing lows, applying logic to filter overlapping zones for chart clarity. Each liquidity zone is divided into four horizontal quadrants, where volume delta—measuring buying versus selling pressure—is calculated to reveal aggressive buyer or seller activity within specific price ranges.
The tool also detects potential reversal signals during liquidity sweeps, displaying four types of volume-based patterns: Absorption (ABS), Exhaustion (EXH), Divergence (DIV), and Snapback Rejection (REJ). These signals help identify unusual volume behavior that may precede price reversals.
A real-time dashboard tracks the historical performance of reversal signals, validating them based on price action within a user-defined evaluation window and hold time. Active zones feature a "Health" metric indicating the extent of volume consumed relative to zone capacity, reflecting liquidity depletion.
Users can customize settings including pivot length, volume capacity, zone visibility, reversal detection toggles, and dashboard display. The indicator supports visualization of liquidity sweeps and reversals, aiding analysis of support and resistance levels through volume and order flow insights.
指标配置
指标分类
支撑与阻力
输出类型
可视化
数据要求
仅 K 线
支持的信号
趋势强度
讨论
客户评价
0.0
评价:0
客户评价
该产品尚无评价。已经试过了?抢先告诉其他人!
常见问答
Liquidity Sweep
Volume
Support & Resistance
cTrader Store 提供的所有产品,包括交易机器人、指标和插件,均由第三方开发者提供,仅供信息参考和技术访问之用。cTrader Store 并非经纪商,不提供投资建议、个人推荐或任何未来业绩保证。
该作者的其他作品









价格
45
销售
2.95K
免费安装