

present
Зарегистрируйтесь и получите скидку $50 на первую покупку
Trading product for MidasMarketDashboard Десктопный плагин Trade Journal File Access, image 1
MidasMarketDashboard
Десктопный плагин
Версия 1.0, Oct 2026
Windows, Mac
Trading product for MidasMarketDashboard Десктопный плагин Trade Journal File Access, image 2
Trading product for MidasMarketDashboard Десктопный плагин Trade Journal File Access, image 3
Trading product for MidasMarketDashboard Десктопный плагин Trade Journal File Access, image 4
С 27/09/2026

Описание

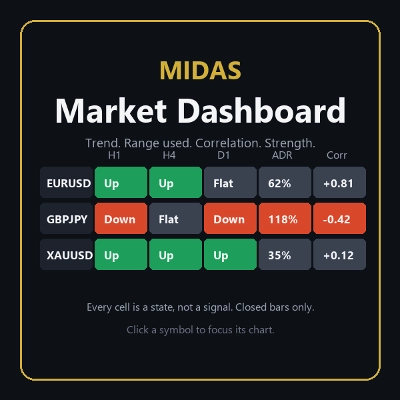
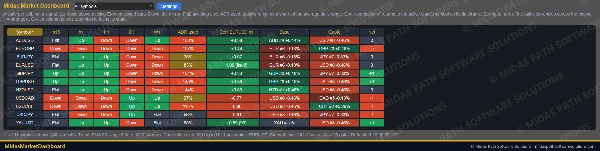
One Trade Watch tab, one grid, a row per symbol of your list. Everything in it is a state, not a signal, and every column says which rule produced it.


The columns

• Trend on each timeframe you choose (M15, H1, H4, D1 and W1 by default): Up when the last closed bar is above its EMA and the EMA is higher than it was a few bars ago; Down for the mirror; Flat otherwise. Closed bars only, so a cell changes when a bar closes, never mid-bar.

• ADR used: today's range as a share of the average daily range of the last 14 days (adjustable). Over 100% is marked, so you can see a day that has already done its usual work.

• Correlation: the correlation of bar-to-bar returns between each symbol and the active chart's symbol, on the active chart's timeframe, over the last 100 closed bars (adjustable), bars matched by time. Switch charts and the column follows. Green moves together, red moves opposite.

• Strength: the rank and percentage move of the pair's two currencies across the 28 pairs between the eight majors, over the last 24 hourly bars (adjustable). 1 is the strongest.

• Net: how many timeframes are Up minus how many are Down.


Working with it

• Click a column header to sort, again to reverse. Click a symbol to focus its chart, or open one if none is open.

• A filter picks rows: Up or Down on H4, on D1, on both; ADR used under 50% or over 100%; correlation above +0.7 or below -0.7.

• Up to 40 symbols. Symbols your broker does not offer are listed under the grid, never shown as numbers.

• Settings and the sort and filter are kept per account.


What it is not

• It does not forecast, score, or say buy or sell. A row that is Up on every timeframe is a description of closed bars, and the next bar can change it.

• Correlation describes the period measured and changes over time; it does not mean two symbols will keep moving together.


Tested

• In a cTrader backtest on EURUSD (September 2026), every day for eight symbols on five timeframes, the trend state was checked against cTrader's own EMA and the rule written out, the correlation of returns to EURUSD against a two-pass Pearson with bars matched by time, the ADR and today's share of it against a plain average, and the strength of the eight majors against a recomputation from the 28 pairs: 2,191 checks, 0 violations.


Notes

• Closed bars only; the grid refreshes every five seconds and the cells move only when bars close.

• It never trades and needs no internet or file access. This is not financial advice.

Сводка

ИИ-сводка
MidasMarketDashboard is a trading platform plugin that consolidates your watchlist into a single grid, displaying key market states for each symbol. It shows trend direction across five customizable timeframes (default: M15, H1, H4, D1, W1) based on EMA analysis of closed bars. The dashboard includes columns for Average Daily Range (ADR) usage, symbol correlation relative to the active chart’s symbol, currency strength rankings among the eight major currencies, and a net trend score (count of Up minus Down timeframes).

Users can sort and filter symbols by trend, ADR thresholds, and correlation values, and click symbols to focus or open their charts. The grid supports up to 40 symbols, with unavailable broker symbols listed separately. All settings, sorting, and filtering preferences are saved per account.

The data updates every five seconds but only changes on bar closes, ensuring stable, state-based information rather than predictive signals. Correlation is calculated over the last 100 closed bars on the active chart’s timeframe, and currency strength is derived from movements across 28 major pairs over the last 24 hourly bars.

MidasMarketDashboard does not provide buy/sell signals or forecasts; it offers descriptive market states to assist traders in analysis and decision-making. It operates offline without trading or internet access requirements.
Профиль плагина
Категория плагина
Управление сделками
Доступ к данным
Рыночные данные
Аккаунт
История
Позиции
Поддерживаемые типы ордеров
Рыночный

Обсуждение

Отзывы покупателей

0.0
Отзывы: 0
Отзывы покупателей
У этого продукта еще нет отзывов. Уже попробовали его? Поделитесь впечатлениями!

Частые вопросы

Trade Journal
File Access
Продукты, доступные в cTrader Store, включая торговых ботов, индикаторы и плагины, предоставляются сторонними разработчиками и доступны исключительно в информационных и технических целях. cTrader Store не является брокером и не предоставляет инвестиционные консультации, персональные рекомендации или какие-либо гарантии будущей доходности.

Больше от этого автора
Индикатор
Volume
Key Levels
+1
Session volume profiles from tick volume: POC, value area high and low, and naked POCs extended until touched.
Индикатор
Key Levels
Liquidity Grab
+2
The levels you mark each morning, drawn and followed: PDH/PDL, weekly, monthly, sessions, equal highs/lows.
сиБот
Partial Close
Prop Firm Fit
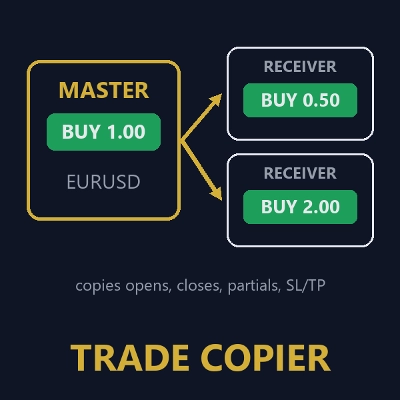
Copies opens, closes, partial closes and SL/TP from one cTrader account to others on the same PC, with safe sizing.
Десктопный плагин
External Data
Study economic event reactions with broker M1 history, bar replay, range comparisons and a reproducible export.

Вам также может понравиться

Десктопный плагин
Risk/Reward
Chart UI Tools
+3
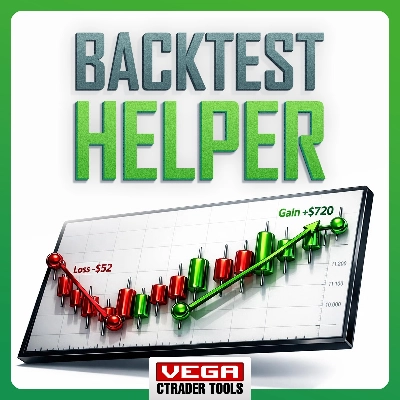
Visual cTrader backtesting tool with trade drawing, risk sizing, stats, and automatic trade simulation.
Десктопный плагин
Prop
Forex
+5
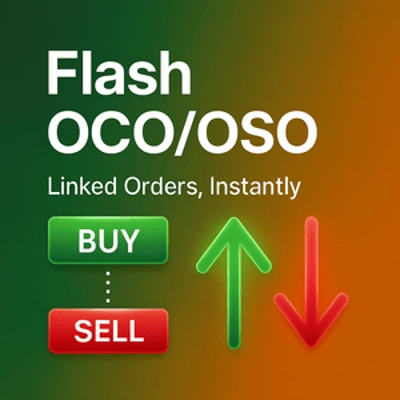
Place professional OCO & OSO orders in cTrader — visually, instantly, and without execution mistakes.
Десктопный плагин
AI
Forex
+5
AI Trading Agent, predict market moves, detect trends, and execute profitable trades.
Десктопный плагин
AI
ATR
+27
Turn your cTrader trade history into a visual performance dashboard to see trading patterns and strategy strength
Десктопный плагин
Forex
Crypto
+4
Apply Stop Loss and Take Profit to all positions and pending orders in one click.
Десктопный плагин
AI
ATR
+27
Trade Analytics delivers advanced trading insights and heatmaps directly inside TradeWatch.
Десктопный плагин
Risk/Reward
Trade Journal
+5
cTrader Journal - Automatic Trade Capture. Offline Reviews. No Subscription.
Десктопный плагин
Prop
Forex
+3
Visual calendar with daily PnL, trades, win rate, profit factor, and performance insights.
Десктопный плагин
ATR
Prop
+5
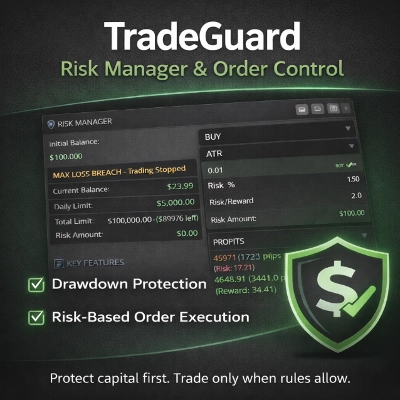
cTrader risk management plugin with daily & total drawdown limits, CBot control, and risk-based order execution.
Десктопный плагин
Forex
Crypto
+3
Seconds | Ticks | Range | RangeY | Delta | Heikin-Ashi Bar types. Any size or Symbol.
Десктопный плагин
Chart UI Tools
Replay your broker’s charts candle by candle. Rewind any time, switch timeframes and practise trades with full stats.
Десктопный плагин
Chart UI Tools
Keep lines, zones and channels synced across selected same-symbol charts from one desktop plugin.
Десктопный плагин
Forex
Signal
+2
Adaptive Renko chart builder for precise, flexible trading - ideal for both scalping and trend analysis.
Десктопный плагин
Trade Journal
Trade Statistics
Journal, statistics, trade analysis and a daily coach for your real cTrader trades. Know why you lose; fix it.
Десктопный плагин
Position Sizer
Risk Calculator
Size manual trades from your risk settings and review Market, Limit or Stop orders before execution.
Десктопный плагин
Prop
Forex
+4
Professional risk management plugin with automatic lot calculation, chart panels, and R:R automation. Version 1.4.2.
Десктопный плагин
Prop Firm Fit
Trade Journal
+1
Paper trade your broker’s live prices in cTrader: demo accounts, prop challenges, a stats dashboard and trading journal
Десктопный плагин
Trade Journal
AI Integration
+1
Turn your closed-trade history into an at-a-glance monthly calendar and a deep performance dashboard.

Цена

С 27/09/2026