

说明
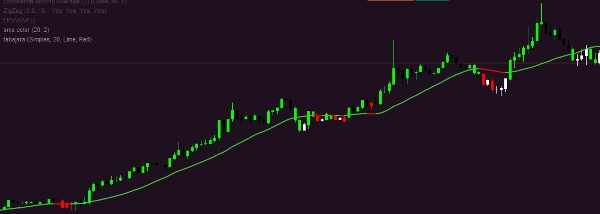
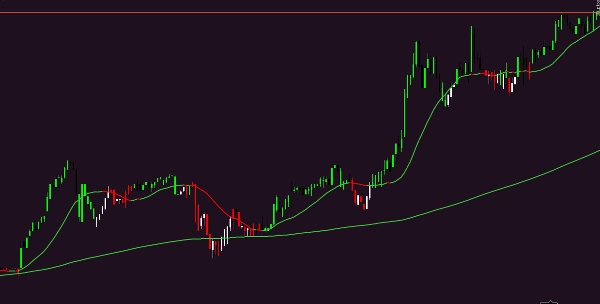
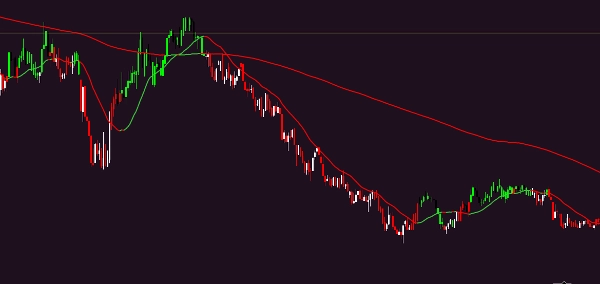
sma 颜色
摘要
AI 摘要
The "sma color" indicator is a technical analysis tool designed to display a simple moving average (SMA) with color differentiation. It visually represents the SMA line on trading charts, potentially using color changes to indicate different market conditions or trends. This indicator aids traders in identifying trend direction and momentum by smoothing price data over a specified period. It is compatible with various trading instruments and timeframes, providing a clear and straightforward way to analyze price movements.
指标配置
客户评价
0.0
评价:0
客户评价
该产品尚无评价。已经试过了?抢先告诉其他人!
讨论
常见问答
cTrader Store 提供的所有产品,包括交易机器人、指标和插件,均由第三方开发者提供,仅供信息参考和技术访问之用。cTrader Store 并非经纪商,不提供投资建议、个人推荐或任何未来业绩保证。
该作者的其他作品


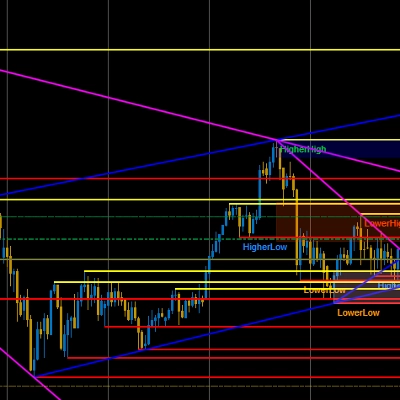
!["Tabajara corrigido[fix]" 标识](https://cdn.ctrader.com/image/webp/7f4bbef8-b245-4ebd-80d7-582fffc0c90c_28378)

猜您喜欢


价格
注册日期 10/02/2025
1.27K
免费安装