
说明
📈 Divergency v1.1 指标适用于 cTrader:全面指南 🚀
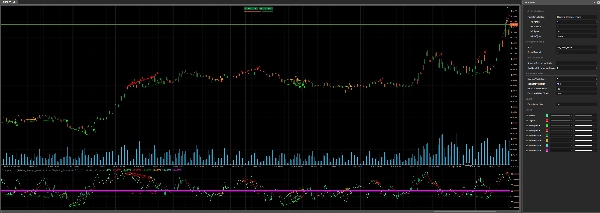
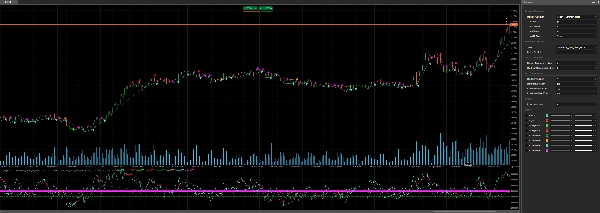
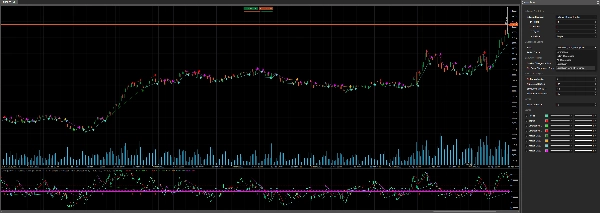
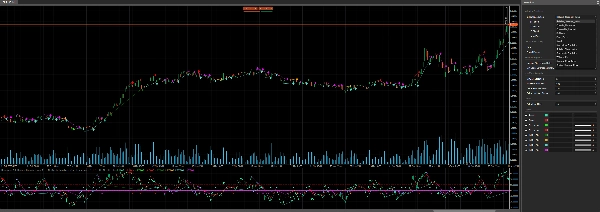
该 Divergency v1.1 指标是为 cTrader 平台设计的强大工具,用于识别价格行为与各种振荡器之间的背离和相关性。本指南详细描述了代码、其功能以及如何有效使用的分步说明。无论您是初学者还是经验丰富的交易者,该指标都能通过可自定义的设置和视觉提示增强您的技术分析。让我们开始吧!🌟
🎯 Divergency11 指标概述
该 Divergency v1.1 指标分析价格走势和振荡器行为以检测:
- 常规背离:当价格和指标朝相反方向移动时,发出潜在反转信号。
- 隐藏背离:当价格和指标以不同方式对齐时,指示趋势延续。
- 相关性:突出显示价格和指标同步移动,暗示趋势强度。
它支持 12 种不同的振荡器(例如,RSI、MACD、随机指标),并允许自定义背离检测参数,使其适用于各种交易策略。该指标直接在图表和指标区域绘制信号,使用彩色线条、图标和文本以清晰可视化。📊
🔍 代码解析
1. 指标设置 🛠️
- 命名空间和类:定义在
cAlgo命名空间中,继承自Indicator的Divergency v1.1类。 - 属性:
-
IsOverlay = false:显示在单独的指标窗口中。TimeZone = TimeZones.UTC:使用 UTC 以保持一致性。AccessRights = AccessRights.None:不需要特殊权限。
2. 参数 ⚙️
该指标通过参数提供广泛的自定义,参数分组以便清晰:
- 振荡器选择:
-
IndicatorSelection:从 12 种振荡器中选择(例如,RSI、MACD、随机指标)。(归一化到 50 作为中间值,结果更高以优化过程)Value1、Value2、Value3:调整周期、平滑和信号线设置。MaType:选择移动平均类型(例如,简单、指数)。
- 背离设置:
-
Strat:选择检测模式(背离、隐藏背离、相关性或组合)。PeriodFractal:设置分形周期以识别峰值/谷值(必须为奇数)。LookBack:分析的历史背离数量。MinCountDivergenceShow:显示信号所需的最小背离数。
- 区域分析:
-
MinBarsValidation、MaxBarsValidation:定义背离检测的有效柱范围。ExtraLevelMin、ExtraLevelMax:设置振荡器超买/超卖阈值。
- 水平线:
-
ExtraLevelLine:调整围绕 50 水平的超卖/超买线。
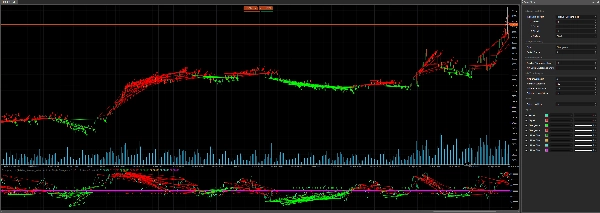
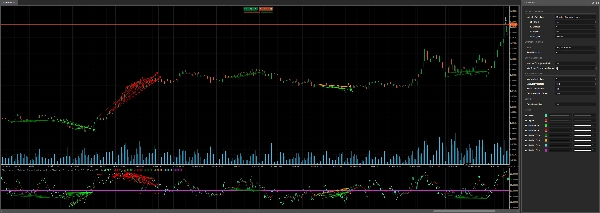
3. 输出 📈
Result:主振荡器值(绿色线)。Signal:平滑信号线(红色线)。- 背离信号(以点绘制):
-
ResDivergenceUp(酸橙色),ResDivergenceDown(红色):常规背离。ResDivergenceUpHidden(绿色),ResDivergenceDownHidden(橙色):隐藏背离。ResCorrelationUp(绿松石色),ResCorrelationDown(品红色):相关性。
4. 关键函数 🧠
- Initialize():设置指标,验证参数,并绘制静态线(超卖、超买、零线)。
- Calculate():计算振荡器值,围绕 50 归一化,并检测用于背离分析的分形。
- GetFractal():识别振荡器中的峰值(fractalUp)和谷值(fractalDown)。
- GetDivergence():分析分形点以检测背离或相关性。
- CreateLine():绘制趋势线和检测到的信号图标。
- DawDivergence():在图表和指标区域用线条和箭头可视化背离。
5. 辅助类 📋
SRPrice:存储分形数据(索引、价格、指标值)。DivergenceFind:跟踪背离详情(标题、时间、价格、颜色)。
6. 错误处理 🚨
该指标检查无效参数(例如,MinBarsValidation > MaxBarsValidation,甚至 PeriodFractal)并使用 DrawStaticText 在指标区域显示警告。
🛠️ 如何使用 Divergency11 指标
步骤 1:安装 📥
- 下载代码:复制提供的 C# 代码。
- 添加到 cTrader:
-
- 打开 cTrader 并导航至 cAlgo > Indicators。
- 点击 New 并将代码粘贴到编辑器中。
- 构建指标(确保无编译错误)。
- 应用到图表:
-
- 在 cTrader 中打开一个图表。
- 从指标列表中添加 Divergency11 指标。
步骤 2:配置参数 ⚙️
根据您的交易风格自定义设置:
- 选择振荡器:
-
- 通过
IndicatorSelection选择振荡器(例如,RSI 的Relative_Strenght_Index)。 - 根据需要调整
Value1(周期)、Value2(平滑)和Value3(信号周期)。
- 通过
- 设置背离类型:
-
- 使用
Strat聚焦于Divergence、Hiden_Divergence、Correlation或All_Divergence。
- 使用
- 分形和回溯:
-
- 将
PeriodFractal设置为奇数(例如 5)以保持对称。 - 调整
LookBack控制分析的历史背离数量。
- 将
- 区域和水平线:
-
- 配置
ExtraLevelMin和ExtraLevelMax以设置超买/超卖区域。 - 设置
ExtraLevelLine以调整视觉阈值。
- 配置
步骤 3:解读信号 📊
- 常规背离:
-
- 向上(酸橙色):看跌信号(价格创出更高高点,振荡器创出更低高点)。
- 向下(红色):看涨信号(价格创出更低低点,振荡器创出更高低点)。
- 隐藏背离:
-
- 向上(绿色):看涨延续(价格创出更低高点,振荡器创出更高高点)。
- 向下(橙色):看跌延续(价格创出更高低点,振荡器创出更低低点)。
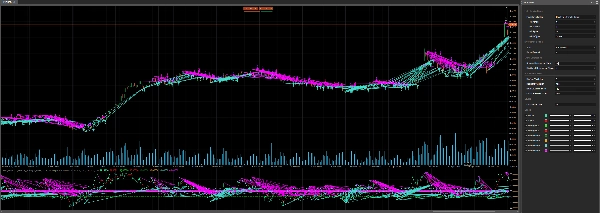
- 相关性:
-
- 向上(绿松石色):强劲的看涨趋势(价格和振荡器均上升)。
- 向下(品红色):强劲的看跌趋势(价格和振荡器均下降)。
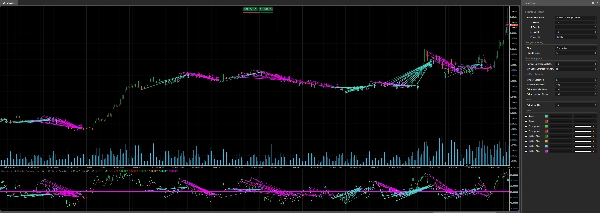
- 视觉提示:
-
- 趋势线连接图表和指标上的背离点。
- 箭头指示信号方向(向上/向下)。
- 文本显示检测到的背离数量(如果
LookBack > 1)。
步骤 4:交易策略 💡
- 反转交易:
-
- 使用常规背离(酸橙色/红色)识别潜在反转。
- 结合其他指标确认(例如,支撑/阻力,蜡烛图形态)。
- 趋势延续:
-
- 隐藏背离(绿色/橙色)表示趋势延续。
- 回调后顺势入场。
- 趋势强度:
-
- 相关性(绿松石色/品红色)确认强劲趋势。
- 用作过滤器,避免逆势交易。
- 时间框架:
-
- 适用于任何时间框架,但较高时间框架(H1、H4)可减少噪音。
- 风险管理:
-
- 为多头设置止损于近期摆动低点下方,空头设置于摆动高点上方。
- 使用代码中包含的 ATR 来确定仓位大小。
步骤 5:优化 🔧
- 回测:使用 cTrader 的回测功能在历史数据上测试指标。
- 调整参数:尝试调整
PeriodFractal、LookBack和MinCountDivergenceShow以减少错误信号。 - 组合指标:与趋势指标(例如,移动平均线)或波动率工具(例如,布林带)配合使用。
🌟 成功小贴士
- 从简单开始:从默认设置和熟悉的振荡器如 RSI 开始。
- 模拟练习:在模拟账户上测试指标以理解其信号。
- 监控警报:关注箭头和趋势线,及时响应信号。
- 避免过度交易:将背离作为更广泛策略的一部分,而非孤立使用。
- 保持更新:关注 cTrader 论坛上的代码更新或社区反馈。
⚠️ 常见问题及解决方案
- 无信号显示:
-
- 检查
MinCountDivergenceShow与LookBack(前者必须 ≤ 后者)。 - 确保
PeriodFractal为奇数。
- 检查
- 信号过多:
-
- 增加
MinCountDivergenceShow或减少LookBack。 - 收紧
MinBarsValidation和MaxBarsValidation。
- 增加
- 错误信息:
-
- 查看指标区域中的参数警告(例如,
MinBarsValidation > MaxBarsValidation)。 - 纠正无效设置并重新应用指标。
- 查看指标区域中的参数警告(例如,
🎉 结论
该 Divergency v1.1 指标是 cTrader 用户的多功能且强大的工具,深入洞察价格与振荡器的关系。凭借其可自定义的设置和清晰的视觉输出,它使交易者能够自信地识别反转、延续和趋势强度。试用它,调整参数,并将其整合到您的交易计划中,以提升您的分析水平!🚀
祝交易顺利,愿您的图表永远绿意盎然!📈💚
摘要
客户评价
5 | 100 % | |
4 | 0 % | |
3 | 0 % | |
2 | 0 % | |
1 | 0 % |


