

说明
ADR 高低线
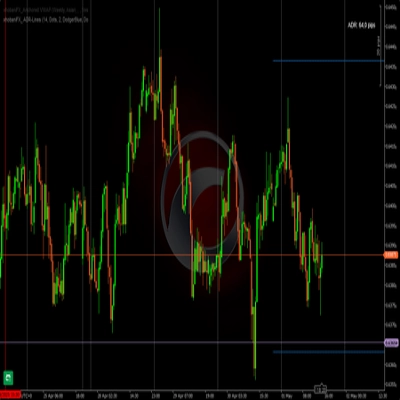
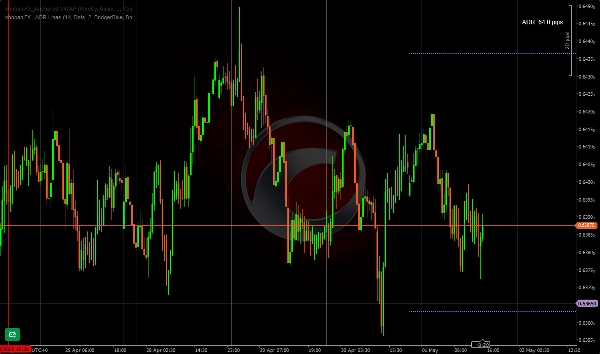
此 ADR 指标根据交易者偏好的周期绘制当天的最低/最高水平的水平线。我喜欢并使用14天作为基准周期。它最适合剥头皮交易者/日内交易者。因此,您可以轻松注意到何时达到高点/低点,您可以选择线条的颜色/样式/宽度,在达到时更改为您选择的不同颜色。
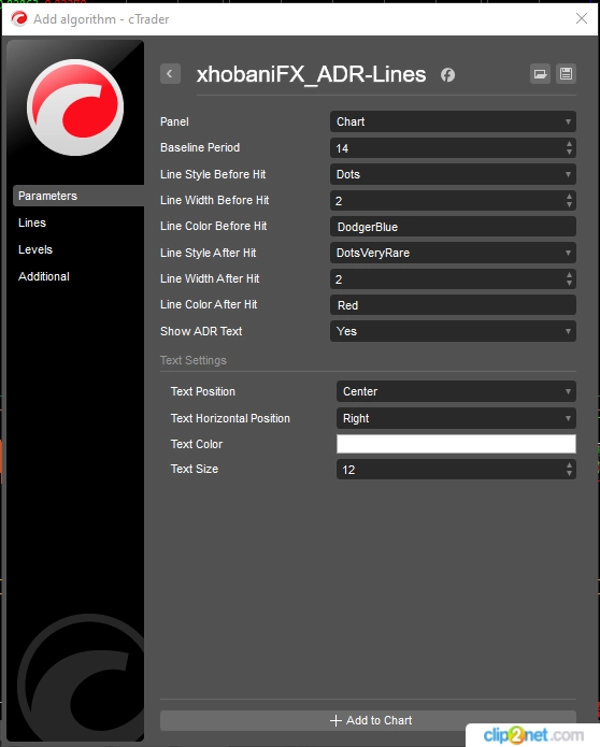
该指标的开发方式使您可以自定义大多数参数,以适应您的偏好并与您的工作空间和颜色保持一致。
祝交易顺利!
xhobani_FX
摘要
AI summary
xhobaniFX_ADR-Lines is an Average Daily Range (ADR) indicator designed for scalpers and intraday traders. It plots horizontal lines representing the current day's high and low levels based on a user-defined period, with 14 days commonly used as a baseline. The indicator visually highlights when these high or low levels are reached by allowing customization of line color, style, and width to change upon being hit. Most parameters are adjustable to fit individual trading preferences and workspace aesthetics. This tool aids traders in quickly identifying key price levels within the trading day.
指标配置
客户评价
4.2
评价:5
5 | 20 % | |
4 | 80 % | |
3 | 0 % | |
2 | 0 % | |
1 | 0 % |
客户评价
May 16, 2025
Tbh it is not magic, just a decent extra filter. H1 makes the signal less noisy.
May 11, 2025
May 8, 2025
The reason it feels usable is the signal gets compared with context, and 2 timeframes keeps the first run grounded.
May 5, 2025
讨论
常见问答
cTrader Store 提供的所有产品,包括交易机器人、指标和插件,均由第三方开发者提供,仅供信息参考和技术访问之用。cTrader Store 并非经纪商,不提供投资建议、个人推荐或任何未来业绩保证。




!["[Stellar Strategies] Inside Bar with Signals" 标识](https://cdn.ctrader.com/image/webp/1d9e8bfa-3b2c-4440-bb37-5856902008a7_30683)



!["Gaussian Channel [Iridio Capital]" 标识](https://cdn.ctrader.com/image/webp/2c4f9ca9-4e9b-476d-b5a6-787c8095032b_61546)








