الوصف
🧠 OBScope™ – رسم خرائط دقيق لكتل الأوامر لصفقات ذات احتمالية عالية
افتح الهيكل الخفي للسوق مع OBScope™، المؤشر المتطور المصمم لاكتشاف وتصوير مناطق كتل الأوامر ذات الاحتمالية العالية بناءً على قمم القمم، وقيعان القيعان، وتحليل حركة السعر المتقدم.
سواء كنت متداولًا متمرسًا أو تعمل على تحسين ميزتك، يمنحك OBScope™ رؤية واضحة كالكريستال لبصمات المؤسسات—حيث يترك المال الذكي علامته.
🔍 الميزات الرئيسية:
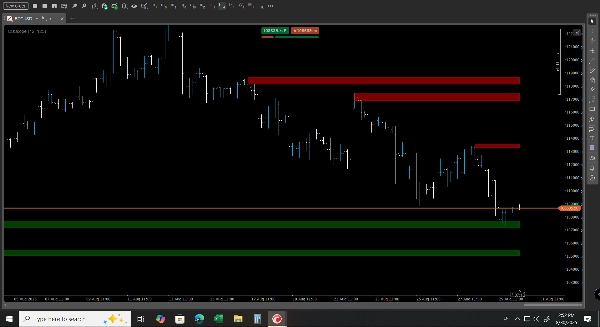
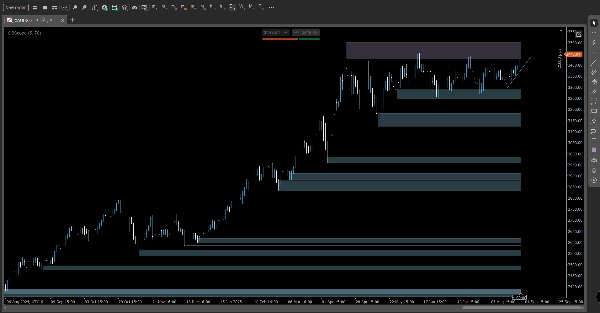
• كشف كتل الأوامر الديناميكي
يحدد تلقائيًا ويرسم المناطق التي انعكس فيها السعر تاريخيًا أو تمركز، باستخدام هيكل القمم والقيعان ومنطق مستند إلى الحجم.
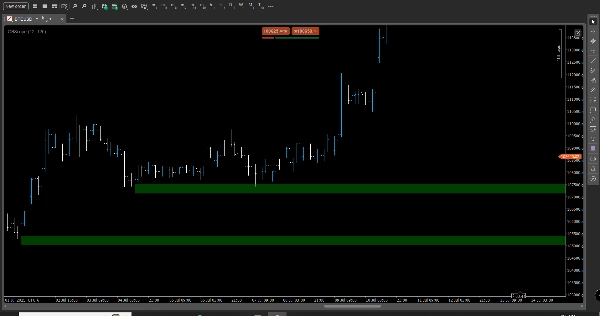
• مناطق صفقات ذات احتمالية عالية
يصفّي الضوضاء ويسلط الضوء فقط على كتل الأوامر الأكثر أهمية إحصائيًا—تلك التي لها تاريخ رد فعل مثبت وترتيبات مخاطرة-مكافأة مثالية.
• منطق قائم على القمم والقيعان
يدمج تحليل القمم والقيعان لتثبيت المناطق في هيكل السوق ذي المعنى، مما يحسن التوقيت والانحياز الاتجاهي.
• تصميم مدفوع بالأداء
مبني على خوارزميات مختبرة مع تحقق من السوق الحقيقي، أظهر OBScope™ نتائج متسقة عبر فئات أصول وأطر زمنية متعددة.
• تصوير قابل للتخصيص
واجهة مستخدم نظيفة ومودولية مع شفافية قابلة للتعديل للمناطق، وترميز لوني—مصممة للعمل اليدوي والخوارزمي.
📈 لماذا يحب المتداولون OBScope™:
• يقلل التخمين في تحديد المناطق
• يعزز التوافق مع استراتيجيات أخرى (مثل مسح السيولة، ملء الاختلالات)
• يدعم إعدادات الاختراق والانعكاس على حد سواء
• مثالي للتداول السريع، تداول التأرجح، وتحديات شركات التداول
الملخص
تقييمات العملاء
5 | 100 % | |
4 | 0 % | |
3 | 0 % | |
2 | 0 % | |
1 | 0 % |


