Candle Pro
Индикатор
121 скачивания
Версия 1.0, Oct 2025
Windows, Mac
5.0
Отзывы: 1
Описание
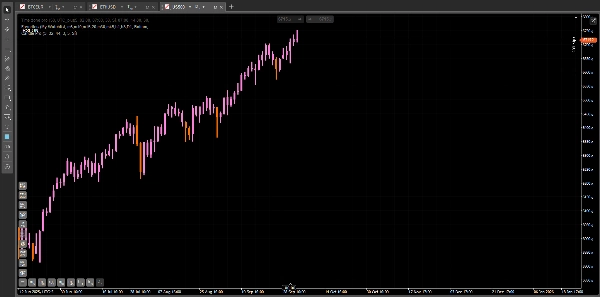
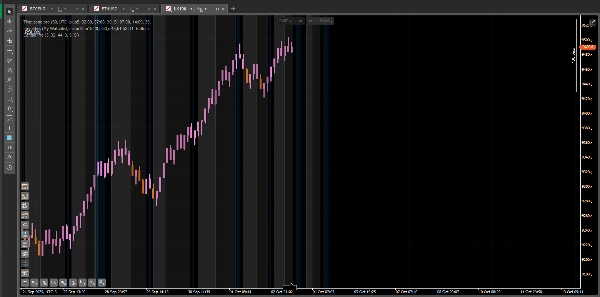
Candle Pro – Визуальные сигналы RSI на свечах
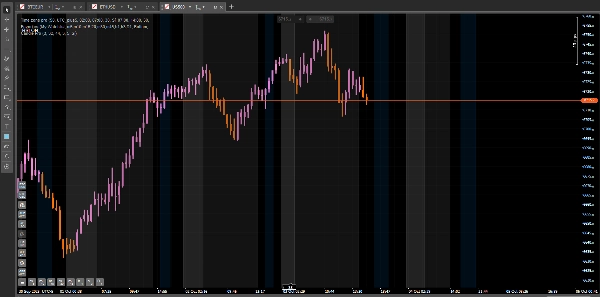
Candle Pro — индикатор, который выделяет свечи прямо на графике, когда RSI достигает уровней перекупленности или перепроданности, позволяя сосредоточиться на ценовом действии и избегать дополнительных субграфиков.
🧭 Как использовать
- Добавьте индикатор на ваш график.
- Настройте параметры RSI в соответствии с вашим стилем торговли.
- Наблюдайте, как свечи меняют цвет на экстремальных уровнях, отмечая потенциальные зоны разворота или импульса.
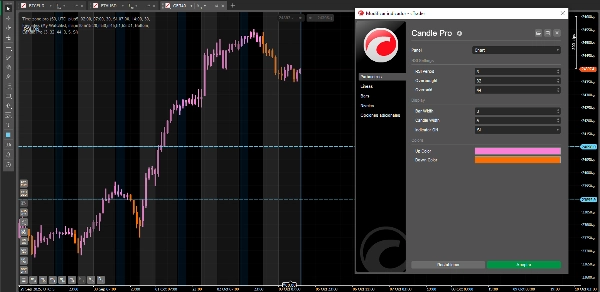
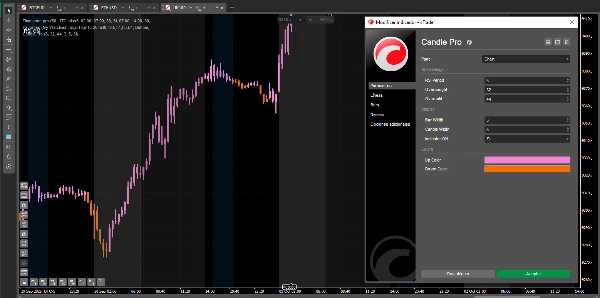
⚙️ Рекомендуемые настройки
Для быстрого и точного отклика:
- Период RSI: 3
- Перекупленность: 32
- Перепроданность: 44
- Ширина свечи: 3
- Ширина бара: 1
✨ Преимущества
- Чистые визуальные сигналы прямо на цене.
- Работает с любым символом и таймфреймом.
- Полностью настраиваемые цвета и ширина линий.
- Идеально подходит для скальпинга, интрадей и свинг-трейдинга.
Примечание: Это бесплатная версия Candle Pro. Скоро выйдет премиум-версия с эксклюзивными функциями, которые выведут вашу торговлю на новый уровень.
Сводка
ИИ-сводка
Candle Pro is a trading indicator designed to visually highlight RSI (Relative Strength Index) signals directly on price candles, eliminating the need for separate RSI sub-charts. It marks candles on the chart when RSI reaches overbought or oversold levels, helping traders identify potential reversal or momentum zones. Users can customize RSI parameters, candle colors, and line widths to suit their trading style. The indicator supports any symbol and timeframe, making it suitable for scalping, intraday, and swing trading strategies. Suggested settings include an RSI period of 3, overbought level at 32, and oversold level at 44 for fast and precise signals. Candle Pro emphasizes clean visual cues integrated with price action to maintain chart clarity. This version is the free edition, with a premium version planned to offer additional features. Supported markets include Forex, Indices, and Crypto.
Профиль индикатора
Отзывы покупателей
5.0
Отзывы: 1
5 | 100 % | |
4 | 0 % | |
3 | 0 % | |
2 | 0 % | |
1 | 0 % |
Отзывы покупателей
November 3, 2025
This is an interesting indicator it really helps to filter out market noise. Thanks
Обсуждение
Частые вопросы
Forex
Indices
RSI
Crypto
Продукты, доступные в cTrader Store, включая торговых ботов, индикаторы и плагины, предоставляются сторонними разработчиками и доступны исключительно в информационных и технических целях. cTrader Store не является брокером и не предоставляет инвестиционные консультации, персональные рекомендации или какие-либо гарантии будущей доходности.


Цена
С 24/02/2025
15
Продажи
1.84K
Бесплатные установки