설명
TRB — 틱 런 바 인디케이터
가격 움직임 이전에 시장 정보 감지
초기 사용자 대상 한정 기간 소개 가격 - 초기 출시 기간이 끝나면 가격이 표준 소매 가격으로 인상되기 전에 지금 할인된 가격으로 사본을 확보하세요.
버전 1.1
자세한 내용을 원하시면 댓글 섹션을 이용하세요
구매 후 설정 가이드가 포함된 비디오 세션 이용 가능
틱 런 바 (TRB) 인디케이터
틱 런 바는 거래 흐름에서 방향성 지속성을 감지하여 시장 미시구조 분석을 확장합니다. 또한 Marcos López de Prado의 Advances in Financial Machine Learning에 기반하여, 이 인디케이터는 일방적인 시장 압력이 예상 수준에서 벗어날 때를 식별하여 기관 주문 분할 및 조정된 거래 활동을 드러냅니다.
핵심 통찰
기관 트레이더들은 대규모 주문을 전략적으로 실행합니다 — 이를 더 작은 조각으로 나누고, 아이스버그 주문 뒤에 거래량을 숨기거나, 시장을 움직이지 않기 위해 알고리즘 실행을 사용합니다. 이러한 전술은 지속적인 일방향 거래 런 형태로 뚜렷한 지문을 남깁니다. 틱 런 바는 한쪽이 주문 흐름을 얼마나 오랫동안 지배하는지 측정하여 이러한 패턴을 감지하며, 무작위 가격 변동이 아닌 의도적이고 공격적인 주문이 발생하는 시점을 드러냅니다.
작동 원리
이 인디케이터는 매수 런 거래량과 매도 런 거래량을 별도로 계산하며 — 전통적인 불균형 지표처럼 서로 상쇄하지 않습니다. 역사적 매수/매도 확률과 평균 거래량에서 도출된 동적 예상 임계값과 비교하여 최대 일방향 거래량 누적(θT)을 추적합니다. 실제 방향성 런이 기대치를 초과하면 새로운 TRB 바가 생성됩니다. 이는 주문 흐름 실행의 "구조적 형태"를 드러내며 — 기관 플레이어의 활동 서명을 보여줍니다.
주요 특징
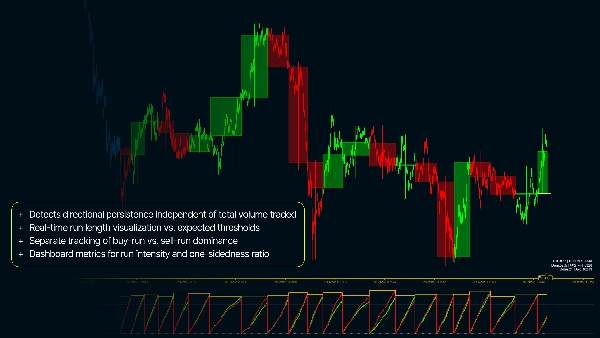
- 총 거래량과 무관하게 방향성 지속성을 감지
- 예상 임계값 대비 실시간 런 길이 시각화
- 매수 런과 매도 런 지배력 별도 추적
- 주문 실행 단계를 보여주는 TRB 멤버십에 따른 차트 캔들 색상 표시
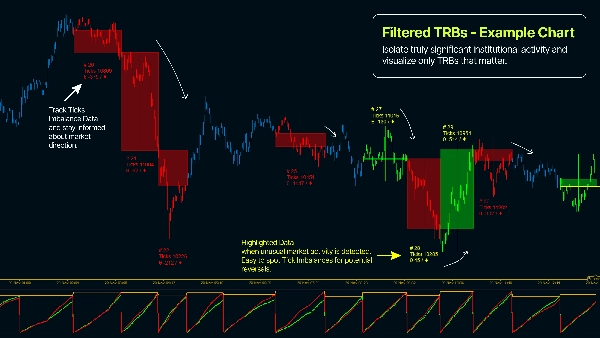
- 진정으로 중요한 기관 활동을 분리하는 최소 거래량 필터
- 런 강도 및 일방성 비율에 대한 대시보드 지표
- 기기 변동성에 맞게 조정 가능한 예상 바 크기 및 EWMA 매개변수
왜 틱 런 바를 사용해야 하나요?
- 완료 전에 실시간으로 기관 주문 실행 식별
- 흐름 분석을 통해 숨겨진 유동성과 아이스버그 주문 패턴 감지
- 무작위 시장 소음과 조정된 거래 구분
- 통계적 이상치뿐 아니라 구조적 주문 불균형에서 가격 움직임 포착
- 알려진 기관 참여 기간 동안 진입/퇴출 타이밍 조절
- 고급 시장 미시구조 이론을 적용하여 더 빠른 시간 프레임에서 우위 확보
- 소규모 소매 거래 급증으로 인한 거짓 신호 감소


!["Smart Money Concepts (SMC) [Iridio Capital]" 로고](https://cdn.ctrader.com/image/webp/28b69fd1-ef54-4bed-9487-07e78e883be4_40934)


