Indicateur de Volume Delta - Analyse Avancée du Flux d'Ordres pour cTrader
L'indicateur de volume Delta analyse le flux d'ordres tick par tick pour révéler la pression d'achat et de vente que l'action des prix seule ne peut montrer. Il calcule la différence entre les upticks (achats) et les downticks (ventes) pour chaque barre, fournissant des informations sur la véritable participation du marché.
Version 1.0
Version stable actuelle pour les périodes inférieures (1m - 15m)
Mises à jour à venir bientôt !
Ce qui le rend unique
Analyse véritable au niveau du tick : Pas une approximation du volume - classification réelle des ticks
Systèmes de divergence doubles : Détection de divergence à la fois au niveau des barres et basée sur les fractales
Validation de qualité : L'estimation de l'écart Corwin-Schultz garantit des signaux fiables
Visualisation flexible : Plusieurs méthodes de coloration et options de filtrage
Personnalisation complète : Chaque couleur, seuil et option d'affichage configurable
Basé sur la recherche : Construit sur des recherches en microstructure de marché évaluées par des pairs
------------------------------------------------------------------------------------------------------------------------------------------------------------
Fonctionnalités principales
------------------------------------------------------------------------------------------------------------------------------------------------------------
Calcul du volume Delta
- Classification selon la règle du tick : Chaque tick est classé comme achat (+1), vente (-1) ou neutre (0)
- Delta de la barre : Pression nette d'achat/vente par barre = Volume d'achat - Volume de vente
- Delta cumulatif : Somme courante montrant une pression directionnelle persistante
- Types de prix multiples : Calcul utilisant les prix Bid, Ask ou Mid
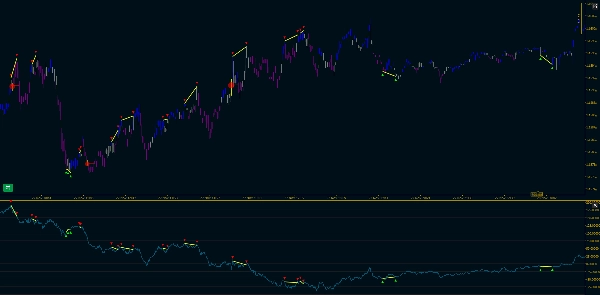
Détection de divergence Delta
Identifie quand le prix et le flux d'ordres sont en désaccord - un signal potentiel de retournement.
Deux méthodes de filtrage :
- Magnitude + Déséquilibre : Seuils directs pour la force du delta et le déséquilibre de volume
- Basé sur les percentiles : Filtrage adaptatif basé sur la distribution historique
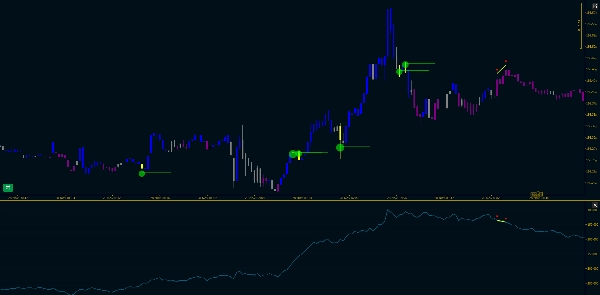
Marqueurs visuels :
- Placés automatiquement au Point de Contrôle (niveau de prix avec le plus grand volume)
- La taille s'adapte à la magnitude du delta
- Lignes de tendance optionnelles s'étendant vers l'avant
Coloration des chandeliers du graphique
Colorer les chandeliers selon le flux d'ordres avec trois niveaux de priorité :
- Divergence (Jaune) - priorité la plus élevée
- Régime CVD (optionnel) - identification d'un régime stable
- Delta de la barre (Vert citron/Rouge/Gris) - coloration barre par barre
------------------------------------------------------------------------------------------------------------------------------------------------------------
Analyse du régime CVD
------------------------------------------------------------------------------------------------------------------------------------------------------------
Deux méthodes pour une coloration stable :
1. Position dans la plage
- Montre où se situe le CVD dans la plage récente (0-100%)
- 30 % supérieurs = haussier | 30 % inférieurs = baissier | 40 % du milieu = neutre
- Rapide, intuitif, auto-adaptatif
2. Filtre de qualité Corwin-Schultz
- Utilise l'estimation réelle de l'écart Corwin-Schultz sur le prix
- Ne fait confiance au CVD que lorsque la liquidité du marché est élevée (écart serré)
- Filtre automatiquement les périodes peu fiables
- Basé sur des recherches évaluées par des pairs (Corwin & Schultz 2012)
Principe clé : Le CVD n'a de sens que sur des marchés liquides. Cette méthode valide la qualité du marché avant d'afficher les signaux CVD.
------------------------------------------------------------------------------------------------------------------------------------------------------------
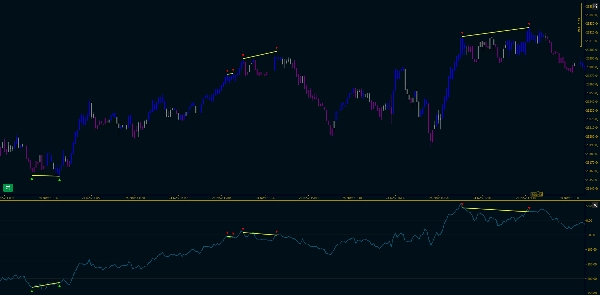
Analyse fractale Prix-Delta
------------------------------------------------------------------------------------------------------------------------------------------------------------
Suit simultanément les points pivots sur le graphique des prix et le delta cumulatif.
Fonctionnalités :
- Détecte les fractales hautes/basses avec des longueurs de pivot configurables
- Suivi séquentiel : suit les hauts consécutifs ou les bas consécutifs
- Détection de divergence : compare la pente du prix vs la pente du CVD entre les pivots
- Double visualisation : marqueurs et lignes de tendance sur le graphique des prix et le panneau indicateur
- Filtre optionnel : Affiche uniquement les fractales divergentes pour une vue claire et ciblée
------------------------------------------------------------------------------------------------------------------------------------------------------------
Sortie visuelle
------------------------------------------------------------------------------------------------------------------------------------------------------------
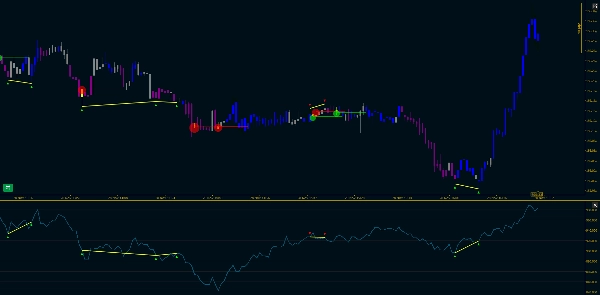
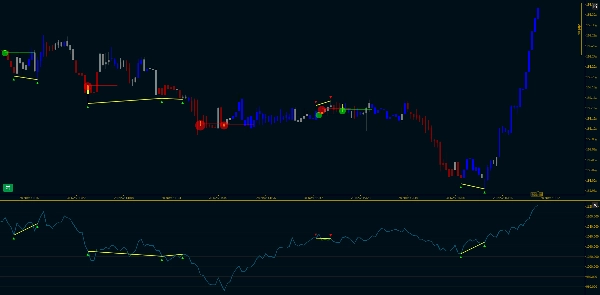
Panneau indicateur
- Histogramme Delta : Barres blanches (normales), barres jaunes (divergences)
- Ligne Delta Cumulatif : Ligne cyan montrant le flux d'ordres courant
- Ligne de référence zéro : Ligne pointillée grise
- Marqueurs fractals : ▼ (hauts) et ▲ (bas) avec lignes de tendance
Graphique des prix
- Chandeliers colorés : Représentation visuelle du régime du flux d'ordres
- Marqueurs fractals : Synchronisés avec le panneau indicateur
- Lignes de tendance fractales : Reliant les pivots avec mise en évidence des divergences
- Marqueurs de divergence : Cercles au Point de Contrôle
------------------------------------------------------------------------------------------------------------------------------------------------------------
Références
------------------------------------------------------------------------------------------------------------------------------------------------------------
- Corwin, S. A., & Schultz, P. (2012). "A Simple Way to Estimate Bid-Ask Spreads from Daily High and Low Prices." The Journal of Finance, 67(2), 719-760.
- López de Prado, M. (2018). Advances in Financial Machine Learning, Chapitre 19.
- Lee, C. M., & Ready, M. J. (1991). "Inferring Trade Direction from Intraday Data." The Journal of Finance, 46(2), 733-746.