الوصف
الميزة المرجحة بالحجم: خارطة طريق كاملة لزخم cTrader
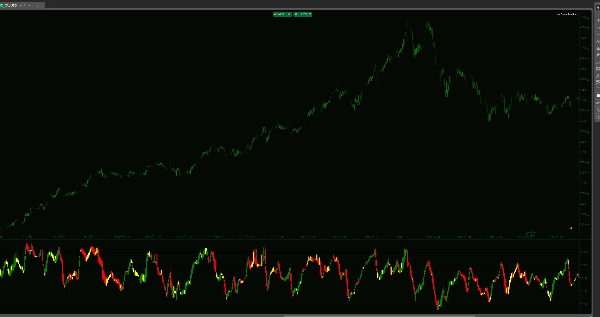
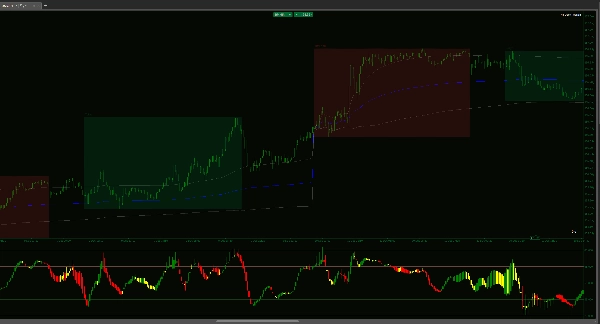
تُظهر المؤشرات القياسية أين كان السعر. يُظهر مؤشر شموع RSI المرجح بالحجم الإقناع وراء الحركة. من خلال دمج حركة السعر، وحجم التيك، وخمسة مستويات مؤسسية حاسمة، يحول هذا الأداة مؤشر RSI من مذبذب بسيط إلى نظام شامل لرسم الاتجاه.
بدلاً من خط واحد، تحصل على شموع OHLC كاملة في نافذة المؤشر الخاصة بك. هذا يسمح لك برؤية "هيكل" الزخم—مما يكشف ما إذا كانت الحركة مدعومة بحجم مؤسسي كبير أو مجرد "خداع" بسيولة منخفضة.
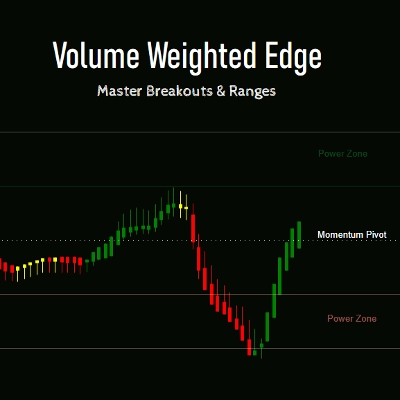
استراتيجية التنفيذ ذات الخمس مناطق
- تمديدات القوة (65–80 و 20–35): هذه هي المناطق ذات الإقناع العالي. عندما تحافظ الشموع المرجحة بالحجم على نفسها هنا، لا تبحث عن انعكاسات—أنت تتابع الاتجاه. هذا هو المكان الذي تعمل فيه الأموال الكبيرة، وحيث تحدث أكثر التحركات انفجارًا.
- ممرات السكالبينج (50–65 و 35–50): مثالية للجلسة الآسيوية أو الأسواق ذات النطاق المحدود. عندما يكون الاتجاه على الإطار الزمني الأعلى محايدًا، توفر هذه المناطق أهداف "الارتداد إلى المتوسط" ذات الاحتمالية العالية. إذا كان السوق يتراوح، تسمح لك هذه الممرات بالسكالبينج للدورات بدقة جراحية.
- محور الزخم (50): الخط النهائي في الرمال. إغلاق جسم شمعة مرجحة بالحجم عبر هذا المستوى هو أول تحذير لك من تحول هيكلي في سيطرة السوق.
لماذا تغير هذه الأداة سير عملك
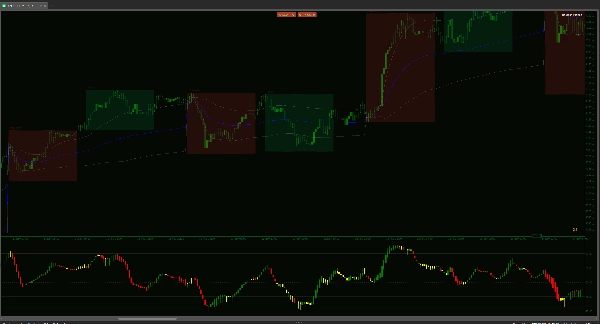
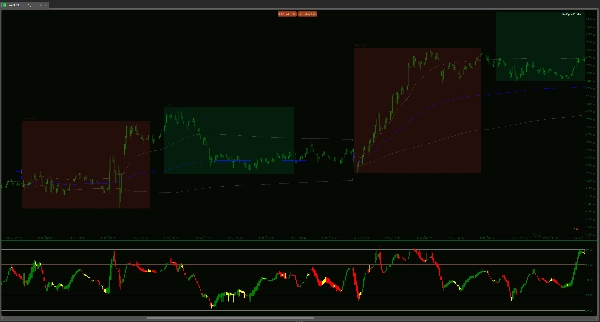
وضوح مرجح بالحجم: يتم حساب كل شمعة بضرب تغير السعر في حجم التيك. إذا حدثت حركة على حجم ضعيف، فلن تؤكد شمعة RSI ذلك. هذا يبقيك بعيدًا عن حركات "الفخ" التي تبدو جيدة على مخطط السعر لكنها بلا دعم.
رؤى جسم الشمعة: خطوط RSI التقليدية متوترة ومتعرجة. تُظهر شموعنا الملساء بواسطة WMA "الفتح" و"الإغلاق" للزخم. إذا كان جسم شمعة RSI سميكًا وصلبًا، فالاتجاه صحي. إذا كانت الفتائل طويلة، فالزخم مستنفد.
تعدد الأسواق: * الاتجاه: استخدم نطاق 65–80 للبقاء في الصفقات الرابحة لفترة أطول.
التراوح/السكالبينج: استخدم ممرات 35–65 لالتقاط الدورات السريعة خلال جلسات منخفضة التقلب مثل آسيا.
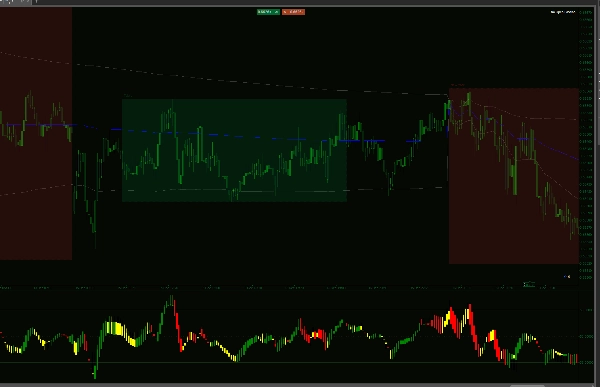
تجنب فخ "الباركود": تجبرك معظم المؤشرات على التخمين خلال فترات التقلب المنخفض. يتميز هذا المؤشر بتأثير بصري فريد "باركود" خلال التماسك. عندما تضيق الشموع، وتسطح، وتتحول إلى الحياد، يخبرك المؤشر أن "محرك السوق" متوقف. هذا التحذير البصري ينقذك من الدخول في خداعات منخفضة الحجم والتعرض لـ "التقطيع" عندما لا يكون هناك مال حقيقي وراء حركة السعر.
تحسين أصلي لـ cTrader: مبني خصيصًا لـ C# API مع منطق "الشموع المرئية القصوى" لضمان بقاء منصتك سريعة الاستجابة، حتى على مخططات الدقيقة الواحدة.
توقف عن التداول بناءً على المكان الذي قد يذهب إليه السوق. ابدأ التداول بناءً على المكان الذي يدفعه الحجم فعليًا. هذا المؤشر ليس فقط عن الإشارات—إنه عن فهم الطاقة الداخلية للسوق.
الملخص
تقييمات العملاء
5 | 33 % | |
4 | 67 % | |
3 | 0 % | |
2 | 0 % | |
1 | 0 % |


![شعار "[Hamster-Coder] Bollinger Bands"](https://cdn.ctrader.com/image/webp/21d8e5d6-fb11-4bac-b9ee-cd05c2b76804_30327)


