الوصف
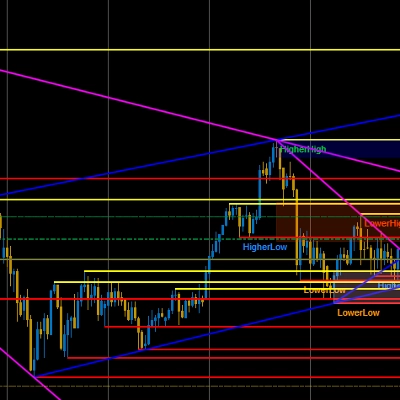
يقوم هذا المؤشر المخصص برسم خطوط شبكة أفقية قابلة للتكوين على أي نوع من المخططات (رينكو، شموع، خط، تيك، نطاق، حجم، نقطة وشكل، وكاجي). يساعد المتداولين على تصور مستويات الطوب في الإطارات الزمنية الأعلى مباشرة على مخططهم في الإطارات الزمنية الأدنى، مما يدعم التحليل متعدد الإطارات الزمنية دون الحاجة للتبديل بين النوافذ.
الميزات الرئيسية:
- يعمل مع جميع أنواع المخططات (رينكو، شموع، خط، تيك، نطاق، حجم، نقطة وشكل، كاجي)
- تباعد الشبكة قابل للتكوين (من 0.1 نقطة فما فوق)
- عدد خطوط الشبكة قابل للتعديل (من 4 إلى 50)
- ألوان الخطوط قابلة للتخصيص لتحسين الرؤية
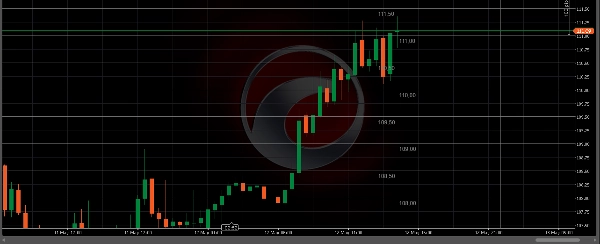
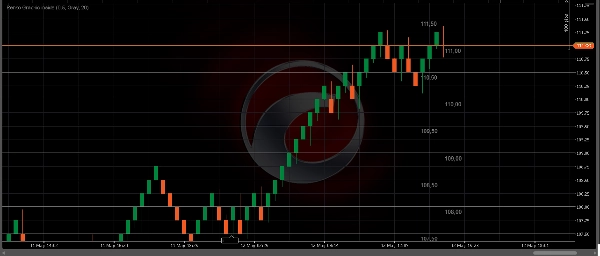
- تسميات مستويات السعر تلقائية للرجوع السريع
حالات استخدام التداول:
- تحديد مستويات الدعم والمقاومة
- إجراء تحليل متعدد الإطارات الزمنية على مخطط واحد
- تصور حدود "الطوب الأعلى" على مخططات رينكو الأدنى
- تحديد مناطق السعر الرئيسية للدخول والخروج
التفاصيل التقنية:
- نوع المؤشر: تراكب بصري / خطوط شبكة
- يعمل على: جميع الإطارات الزمنية (تباعد الشبكة يعتمد على السعر وليس الوقت)
- متوافق مع: الفوركس، المؤشرات، السلع، العملات الرقمية، الأسهم
⚠️ إخلاء المسؤولية: التداول ينطوي على مخاطر خسارة. الأداء السابق لا يضمن النتائج المستقبلية. هذا المؤشر هو أداة بصرية ولا يولد إشارات تداول. استخدم دائمًا إدارة مخاطر مناسبة.
📌 قد تعجبك أيضًا:
اطلع على مؤشرات أخرى احترافية متوفرة في متجر cTrader الخاص بي:
🔵 درجة جودة الإشارة - درجة من 0 إلى 100 لتصفية دخولك (RSI، الحجم، ATR، الاتجاه) - عرض المنتج
🟢 كاشف نظام السوق - يحدد الأسواق المتجهة، المتراوحة والمتقلبة مع كشف التراجع - عرض المنتج
🟠 مبرز منطقة قتل الجلسة - يصور جلسات لندن، نيويورك، طوكيو، سيدني ومناطق قتل ICT - عرض المنتج
⚙️ مركز التمرير التلقائي الذكي - يحافظ على السعر في مركز المخطط مع تحكم يدوي في التكبير - عرض المنتج
قم بزيارة ملفي الشخصي لرؤية جميع المنتجات: CapitalMente على متجر cTrader
الدعم:
لأي أسئلة أو طلبات ميزات، تواصل معي عبر متجر cTrader.
كيفية الاستخدام:
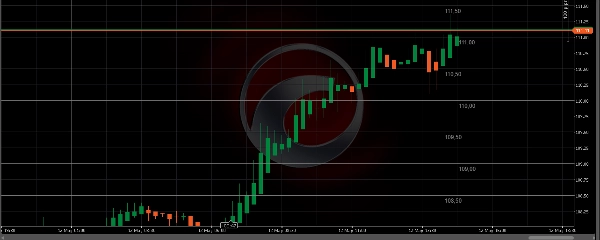
قم ببساطة بإرفاق المؤشر على أي مخطط واضبط معلمة "حجم رينكو الأعلى" لتحديد تباعد الشبكة. عدد الخطوط والألوان قابلة للتخصيص بالكامل.
الملخص
Key features include adjustable grid spacing starting from 0.1 points, a customizable number of grid lines ranging from 4 to 50, and selectable line colors for enhanced visibility. The indicator automatically labels price levels for quick reference.
This tool supports various markets such as Forex, Indices, Commodities, Crypto, and Stocks, and works across all timeframes since the grid spacing is price-based rather than time-based. It is primarily used to identify support and resistance levels, visualize higher brick boundaries on lower Renko charts, and highlight key price zones for trade entries and exits.
To use, attach the indicator to any chart and set the "Higher Renko Size" parameter to define grid spacing. The number of lines and their colors can be fully customized to suit individual preferences. This indicator serves as a visual aid and does not generate trading signals.
تقييمات العملاء
5 | 100 % | |
4 | 0 % | |
3 | 0 % | |
2 | 0 % | |
1 | 0 % |