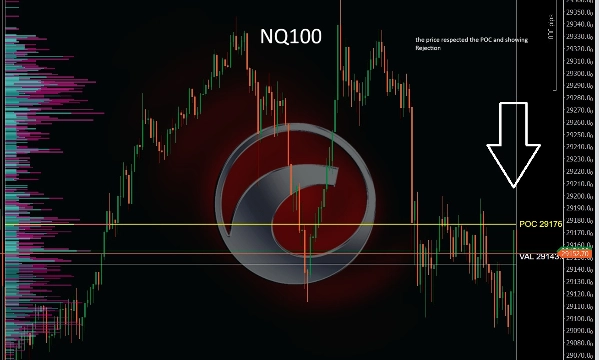
Trading product for TradingV Fixed Range Volume Profile مؤشر Key Levels Volume, image 1
مؤشر
الإصدار 1.1، May 2026
Windows, Mac
Trading product for TradingV Fixed Range Volume Profile مؤشر Key Levels Volume, image 2
Trading product for TradingV Fixed Range Volume Profile مؤشر Key Levels Volume, image 3
منذ 02/01/2025

الوصف

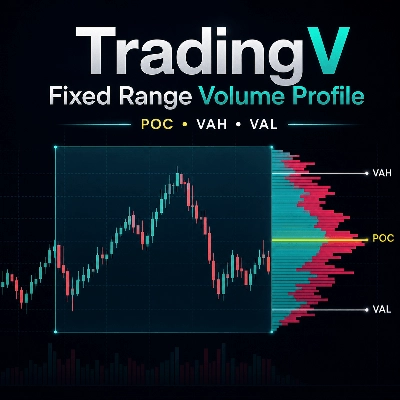
TradingV Fixed Range Volume Profile هو أداة احترافية لملف الحجم مصممة لمساعدة المتداولين على تحليل مكان تركيز نشاط التداول داخل نطاق سعري محدد.


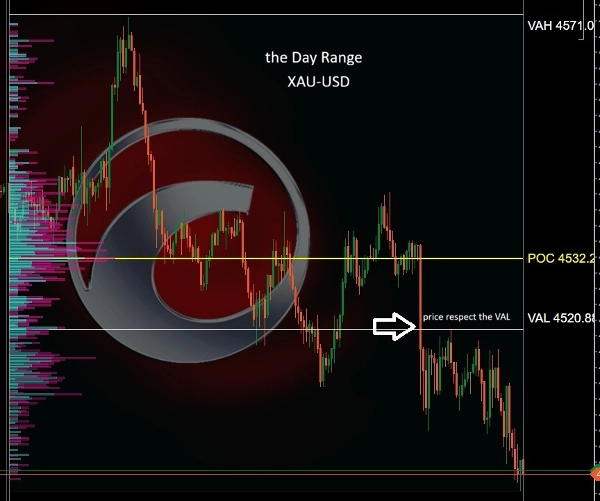
يعرض المؤشر توزيع الحجم للنطاق المختار ويسلط الضوء على أهم مستويات هيكل السوق: POC و VAH و VAL. تساعد هذه المستويات المتداولين على تحديد مناطق السيولة العالية، ومناطق القيمة العادلة، والدعم والمقاومة المحتملين، ومناطق التفاعل المهمة للدخول والخروج وإدارة التداول.


يُستخدم ملف الحجم على نطاق واسع من قبل المتداولين المحترفين، وتم بناء العديد من استراتيجيات التداول الناجحة حول فهم مكان تراكم الحجم، وأين يتم قبول السعر، وأين قد يرفض السعر. يمكن أن يعمل POC كنقطة مرجعية رئيسية لتوازن السوق، بينما تساعد VAH و VAL في تحديد الحدود العليا والسفلى لمنطقة القيمة.


كيفية استخدام المدخلات:


وضع النطاق:

اختر كيفية تحديد نطاق الملف.

- SessionToday: يبدأ تلقائيًا من وقت بدء الجلسة المحدد ويستمر حتى أحدث شمعة متاحة.

- ManualTime: يتيح لك تعيين وقت البدء ووقت الانتهاء للملف يدويًا.

- VisibleRange: يحسب الملف بناءً على نطاق الرسم البياني المرئي حاليًا.


ساعة بدء الجلسة / دقيقة بدء الجلسة:

تُستخدم مع وضع SessionToday لتحديد بداية جلسة التداول. على سبيل المثال، إذا كانت جلسة السوق تبدأ في 01:05، قم بتعيين الساعة إلى 1 والدقيقة إلى 5.


وقت البدء / وقت الانتهاء:

تُستخدم مع وضع ManualTime لتحديد نطاق ثابت مخصص. إذا تُرك وقت الانتهاء فارغًا، يستخدم المؤشر أحدث شمعة متاحة.


إعدادات اللون:

قم بتخصيص لون حجم الصعود، ولون حجم الهبوط، ولون POC، ولون VAH/VAL، وعتامة صندوق النطاق، وعتامة الملف، وعتامة منطقة القيمة لتتناسب مع نمط الرسم البياني الخاص بك.


حالات الاستخدام النموذجية:

- إيجاد مناطق السيولة الرئيسية داخل الجلسة

- تحديد حدود منطقة القيمة

- تخطيط الدخول بالقرب من POC أو VAH أو VAL

- إدارة الخروج حول مستويات الحجم المهمة

- مقارنة موقع السعر الحالي بالقيمة المقبولة

- دعم قرارات حركة السعر، والتداول اليومي، والتداول السريع، وتداول التأرجح


هذا المؤشر مناسب للمتداولين الذين يستخدمون ملف الحجم، وهيكل السوق، ونظرية سوق المزاد، والدعم والمقاومة، أو طرق التداول القائمة على السيولة. تم تصميمه ليعطي عرضًا بصريًا واضحًا لمكان تداول السوق لأكبر حجم داخل نطاق ثابت.


ملاحظة:

TradingV Fixed Range Volume Profile هو أداة تحليلية ولا يوفر إشارات شراء أو بيع بحد ذاته. يجب استخدامه مع خطة التداول الخاصة بك، وإدارة المخاطر، وتأكيد السوق.

الملخص

ملخص الذكاء الاصطناعي
TradingV Fixed Range Volume Profile is a volume profile indicator that visualizes the distribution of traded volume within a user-selected price range. It highlights key market structure levels including the Point of Control (POC), Value Area High (VAH), and Value Area Low (VAL). These levels assist traders in identifying high-liquidity zones, fair value areas, and potential support and resistance, aiding in entry, exit, and trade management decisions.
The indicator offers flexible range selection modes:
- SessionToday, which automatically sets the range from a defined session start time to the latest candle;
- ManualTime, allowing custom start and end times;
- VisibleRange, which uses the currently visible chart area.
Users can customize colors for up-volume, down-volume, POC, VAH/VAL, and adjust opacity settings to fit their chart style. Typical applications include locating key liquidity zones, defining value area boundaries, and supporting various trading styles such as intraday, scalping, and swing trading.
TradingV Fixed Range Volume Profile is designed for traders employing volume profile, market structure, auction market theory, or liquidity-based methods. It provides a clear visual representation of volume concentration but does not generate buy or sell signals independently.

ملف تعريف المؤشر
فئة المؤشر
الحجم
نوع المخرجات
التصور
متطلبات البيانات
الحجم
بيانات التيك
الإشارات المدعومة
لمس المستوى
كسر المستوى

تقييمات العملاء

0.0
التقييمات: 0
تقييمات العملاء
لا توجد تقييمات لهذا المنتج حتى الآن. هل جرَّبته بالفعل؟ كن أول من يخبر الآخرين!

مناقشة

الأسئلة الشائعة

Key Levels
Volume
Market Structure
Support & Resistance
يتم توفير المنتجات المتاحة من خلال cTrader Store، بما في ذلك روبوتات التداول والمؤشرات والإضافات، من قبل مطوري الطرف الثالث وإتاحتها لأغراض الوصول المعلوماتي والفني فقط. cTrader Store ليس وسيطًا ولا يقدم نصائح استثمارية أو توصيات شخصية أو أي ضمان للأداء المستقبلي.

قد يعجبك أيضًا

مؤشر
The long awaited new and improved Supply Demand Premium V2 indicator. Unlock greater trading opportunities now!
مؤشر
XAUUSD
Professional Volume Profile Indicator - Shows volume distribution, POC, Value Areas & Buy/Sell pressure.
مؤشر
Key Levels
Liquidity Grab
+3
Visual market context dashboard showing bias states, CE positioning, session status and sweep context.
مؤشر
ADX
EMA
+4
A multi-timeframe dashboard for cTrader that scores trend direction, momentum, and strength across M15, H1, H4, and D1.
مؤشر
ATR
Forex
+6
The Smart Money Concepts indicator is an all-in-one overlay tool that automatically detects OB, FVG ecc..
مؤشر
Forex
Crypto
+3
MARainbow gives you the edge with four customizable moving averages—each color-coded for instant recognition.
مؤشر
ATR
RSI
+5
Delta RSI Candle Pro, the indicator that transforms ordinary candlesticks into powerful momentum visualizers.
مؤشر
Indices
Commodities
The Advanced CCI & EMA Indicator combines the CCI with 40 & 80 EMA logic to generate precise arrows signaling direction
مؤشر
Key Levels
Liquidity Sweep
Professional Opening Range Breakout, Initial Balance, False breakout Detection
مؤشر
AI
SMC
+9
Identifies market trends (-10 to +10) using HMA with volume confirmation. Includes customizable alerts.
مؤشر
AI
Prop
+14
Professional Trading Indicator Transform Your Trading with Intelligent Signal Detection RenkoProfit
مؤشر
MSS
Key Levels
+2
Maps equal highs, equal lows and active liquidity pools directly on your cTrader chart.
مؤشر
ATR
RSI
+16
Multi-timeframe trend indicator using EMA, MACD & ADX to confirm high-probability buy and sell bias.
مؤشر
ATR
Prop
+14
Optimize exits with Chandelier Exit! Visualize stop-loss points dynamically for improved trading precision and safety.
مؤشر
Aggressive
Supertrend
+5
Stop trading with tunnel vision! 🚫 The Heat Map Dashboard is an institutional-grade visual trading assistant
مؤشر
BOS
CHOCH
+1
Maps unmitigated SMC swing points. Draws infinite structure lines until price touches them, labeling BOS & CHoCH breaks.
مؤشر
RSI
MACD
Unlock market insights with our Multi-Timeframe Market Levels indicator, enhancing your trading strategies effortlessly
مؤشر
AI
SMC
+5
Coloring trendline/ Colored Trendline / Color Trendline

السعر

منذ 02/01/2025