Descrição
【cTrader Exclusive】WeisWaveSpike — Unveil Smart Money Inflows & Trend Reversals with the Next-Gen Volume Wave Oscillator
■ Overview
"WeisWaveSpike (WWS)" is a premium cTrader oscillator that merges Richard Wyckoff's classic "Weis Wave Volume" theory with an advanced Fibonacci-based "Spike Detection" mechanism.
By quantifying the cumulative volume of individual market waves, it visually exposes institutional "Smart Money" (Whales) movements, capturing critical trend exhaustion points (The Climax Reversal) with exceptional clarity.
1. Market Data and Conditions Analyzed
WWS meticulously analyzes the interplay between price structure (waves) and market energy (tick volume) within the Forex market.
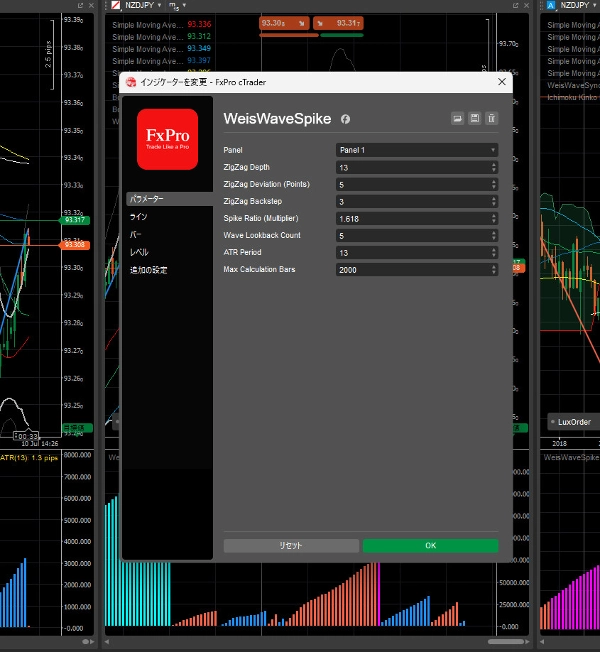
- Structural Wave Mapping: Utilizes a precise, noise-filtered ZigZag algorithm (Default: Depth 13, Backstep 3, Deviation 5) to map out meaningful market swings.
- Volume Accumulation: Instead of evaluating volume bar-by-bar, it calculates the cumulative tick volume poured into a specific wave (bullish or bearish). This tracks the true sustaining power behind the current market movement.
- Volatility Tracking: Automatically measures the current market volatility using a 13-period ATR (Average True Range), converting it precisely into pips.
2. Signal and Visual Component Interpretation
Designed with high-visibility neon and modern contrast styling, allowing you to gauge market conditions at a single glance.
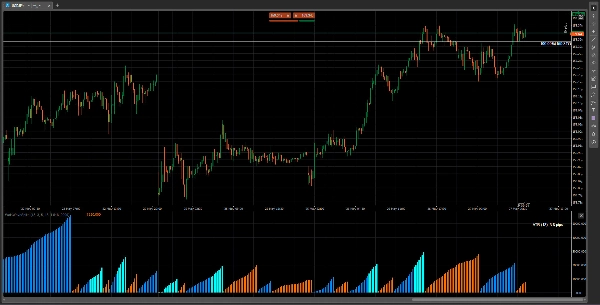
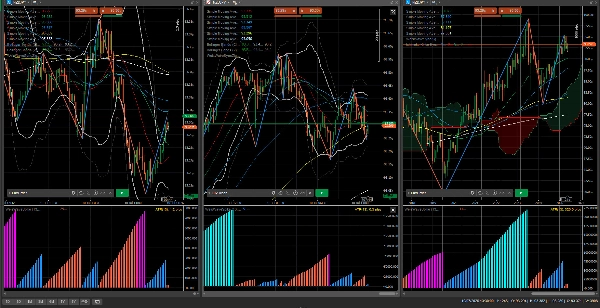
- Normal Up Wave 【Cold Tone: DeepSkyBlue】 Indicates buyers dominate the market, showing a healthy ongoing bullish wave. Increasing histogram height suggests robust upside momentum.
- Normal Down Wave 【Warm Tone: OrangeRed】 Indicates sellers dominate the market, showing a healthy ongoing bearish wave.
- Spike Up Wave (Anomaly Alert) 【Neon Cyan】 ★Critical Signal Triggered the exact moment the current bullish cumulative volume exceeds the "Golden Ratio" (1.618x) of the previous bearish wave's total volume. This confirms aggressive institutional buying (Buying Climax or strong Bullish Breakout).
- Spike Down Wave (Anomaly Alert) 【Neon Magenta】 ★Critical Signal Triggered the exact moment the current bearish cumulative volume exceeds the 1.618x ratio of the previous bullish wave's total volume. This signals massive institutional selling pressure (Selling Climax or strong Bearish Breakout).
- ATR Display 【Top Right Corner】 Automatically accounts for different currency pairs and point configurations (e.g., 3-digit JPY pairs vs. 5-digit USD pairs), displaying the current ATR(13) cleanly converted into "pips."
3. Key Settings and Parameters
Easily tailored to suit any trading style, from intraday scalping to macro swing trading.
- ZigZag Depth (Default: 13): The lookup period to detect market waves. Increase for major swings; decrease for minor intraday waves.
- ZigZag Backstep (Default: 3): The minimum bars required between swing high/low points to finalize a peak/trough.
- ZigZag Deviation (Pips) (Default: 5.0): The minimum pip distance required to qualify a wave reversal.
- ATR Period (Default: 13): The period utilized for calculating current market volatility for the pip display.
- Spike Ratio (Default: 1.618): The Fibonacci multiplier threshold that switches the color to neon.
- Max Bars (Default: 2000): The performance optimization parameter that handles data recalculations flawlessly, ensuring a lightweight and bug-free cTrader execution.
4. Typical Use Cases and Trading Scenarios
Scenario A: Capturing Trend Exhaustion (The Climax Reversal)
- During a strong uptrend, an explosive Neon Cyan (Spike Up) bar appears on the oscillator.
- Meanwhile, on the main chart, price action stalls, printing long upper wicks and failing to make substantial higher highs.
- [Interpretation] Institutional players have slammed massive buy orders to lure retail traders, while secretly dumping their positions (Buying Climax).
- [Entry] Short (Sell) the moment the next wave transitions to a Down Wave (OrangeRed), riding the smart money's sharp reversal downward.
Scenario B: Riding Institutional Breakouts (Trend Following)
- The market has been trapped in a tight range or consolidation pattern.
- Price breaks below a key support level, accompanied by a sudden flash of Neon Magenta (Spike Down) on the oscillator.
- [Interpretation] This is not a false move; institutional money has heavily stepped in to initiate a real, massive downtrend.
- [Entry] Go Short (Sell) immediately in the direction of the breakout, riding the massive momentum generated by the institutional spike.
5. Ideal Trader Profile
- Target Level: Intermediate to Advanced Traders
- Trading Style: Day Trading, Swing Trading
- Best Suited For:
- Serious traders who avoid blind rule-following and seek to read the psychological footprint of institutional capital ("Smart Money").
- Those who feel the limitations of lagging price-based indicators (like Moving Averages or RSI) and wish to utilize Volume (Tick Volume) as a leading analytical tool.
- Dedicated cTrader users who want a professional, optimized edge designed specifically for true ECN environments.
6. Important Limitations and Usage Notes
- Forex-Only Design WWS is meticulously fine-tuned specifically for FX pip sizing and tick volume behaviors. Applying it to Index CFDs, Commodities (Gold/Oil), or Crypto will trigger an automatic safety interlock, halting calculations and displaying an error message on your chart.
- Real-time Recalculation Behavior To maintain 100% accuracy and eliminate typical repainting bugs, the wave calculation engine completely refreshes the last 2000 bars on every incoming tick. Consequently, if a ZigZag peak updates, the historical color and height of the wave bars will realign in real-time. This is a feature—not a bug—ensuring your data remains mathematically synced with the true wave structures.
- Highly Recommended Companion To ensure your main chart visuals perfectly match the oscillator's backend math, we strongly advise using our companion indicator,
WeisWaveSyncZigZag, directly on your main price chart.