คำอธิบาย
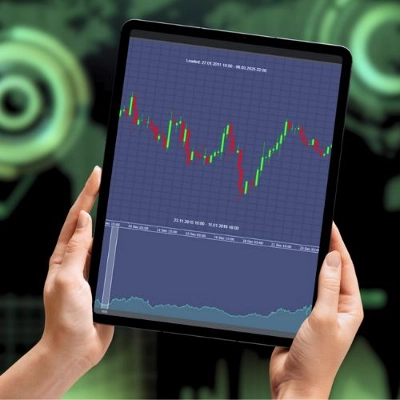
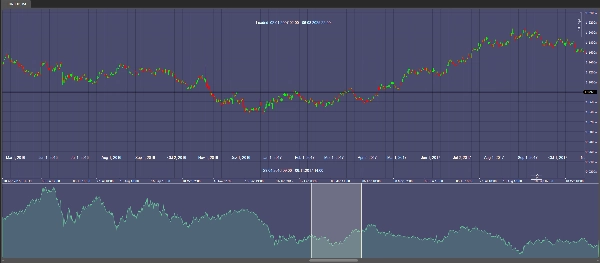
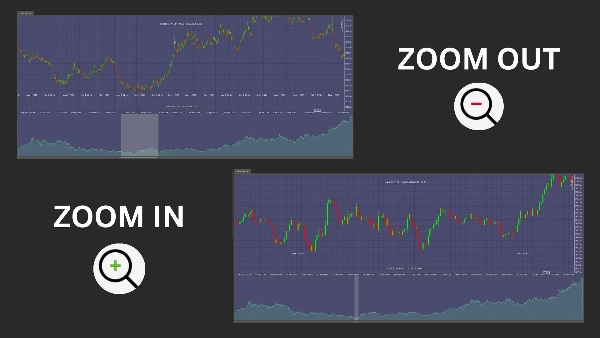
ChartOverview ช่วยให้คุณได้รับข้อมูลครบถ้วนเกี่ยวกับช่วงข้อมูลทั้งหมดของตลาด ตั้งแต่จุดข้อมูลแรกสุดจนถึงจุดข้อมูลล่าสุดที่มีให้ใช้งาน ที่ด้านบนของแผนภูมิของคุณ คุณจะเห็นการแสดงผลที่ชัดเจนของช่วงเวลาที่โหลดครบถ้วน ขณะที่ช่วงเวลาที่มองเห็นในปัจจุบันจะแสดงอยู่บนแผนภูมิโดยตรงเพื่อให้ข้อมูลเชิงลึกแบบเรียลไทม์
ตัวบ่งชี้แบบไดนามิกนี้อัปเดตอย่างราบรื่นเมื่อคุณเลื่อน ลาก หรือปรับขนาดแผนภูมิของคุณ เพื่อให้แน่ใจว่าคุณมีข้อมูลที่ทันสมัยอยู่เสมอ การออกแบบที่ใช้งานง่ายช่วยให้คุณระบุแนวโน้มและโอกาสในตลาดได้อย่างรวดเร็ว เพิ่มความสามารถในการตัดสินใจซื้อขายที่ทันเวลาและมีข้อมูลครบถ้วน
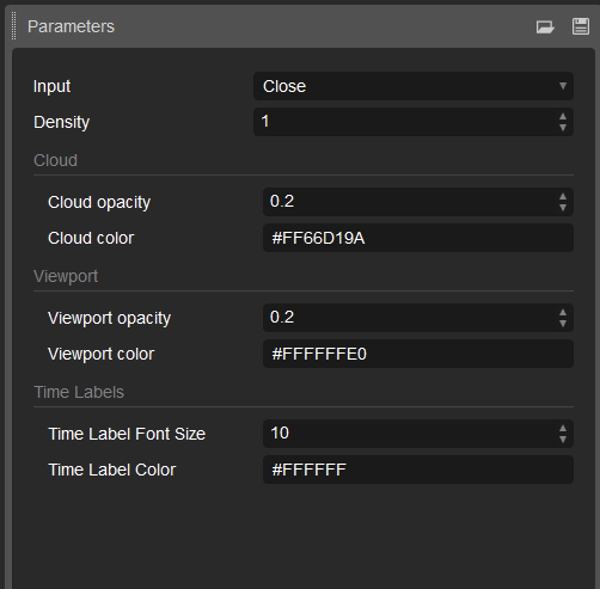
ด้วยตัวเลือกการปรับแต่งที่หลากหลายสำหรับสี ความทึบ และการตั้งค่าการแสดงผล ChartOverview ผสานรวมได้อย่างลงตัวกับการตั้งค่าการซื้อขายส่วนตัวของคุณ เสริมพลังการวิเคราะห์และสร้างความได้เปรียบในการแข่งขันด้วยเครื่องมือที่ออกแบบมาเพื่อมอบภาพรวมตลาดที่แม่นยำและครบถ้วน
สรุป
รีวิวจากลูกค้า
5 | 100 % | |
4 | 0 % | |
3 | 0 % | |
2 | 0 % | |
1 | 0 % |