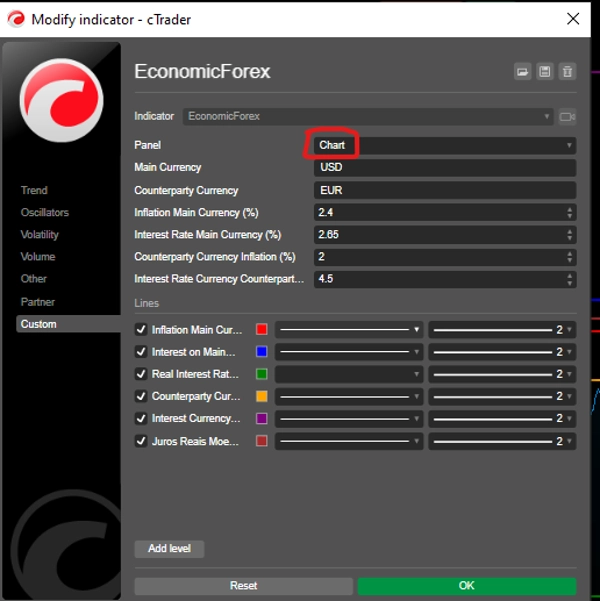
Описание
✔ Веб-сайт для ввода данных, вкладка индикаторов: https://tradingeconomics.com/
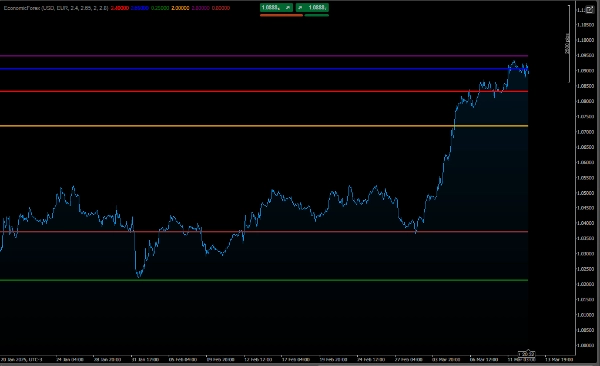
Как интерпретировать график
Разница между номинальной и реальной процентной ставкой:
Номинальная процентная ставка — это валовое значение процентной ставки.
Реальная процентная ставка учитывает инфляцию, показывая реальную покупательную способность денег.
Если инфляция выше номинальной процентной ставки, реальная процентная ставка будет отрицательной, что указывает на потерю покупательной способности.
Сравнение валют:
График позволяет сравнить экономические условия двух валют.
Например, если реальная процентная ставка основной валюты выше, чем у валюты-контрагента, это может указывать на то, что основная валюта более привлекательна для инвестиций.
Изменение во времени:
Линии показывают, как инфляция, номинальная и реальная процентные ставки меняются со временем, позволяя выявлять тенденции.
Пример использования
Предположим, вы установили параметры следующим образом:
Основная валюта: USD (доллар США)
Инфляция: 5%
Номинальная процентная ставка: 6,5%
Валюта-контрагент: EUR (евро)
Инфляция: 2%
Номинальная процентная ставка: 4%
График покажет:
USD:
Реальная процентная ставка: 1,5% (6,5% - 5%)
EUR:
Реальная процентная ставка: 2% (4% - 2%)
С этим вы можете сравнить экономические условия USD и EUR и принимать обоснованные решения на рынке форекс.
Заключение
Этот код является полезным инструментом для трейдеров и аналитиков, которые хотят отслеживать и сравнивать экономические показатели двух валют в валютной паре. Он предоставляет информацию об инфляции, номинальных и реальных процентных ставках, помогая понять макроэкономическую ситуацию и ее влияние на рынок форекс.
посмотрите этот алгоритм с низким риском:👇🏻
https://ctrader.com/pt/products/601?u=carneiroads
https://ctrader.com/pt/products/623?u=carneiroads
Сводка
The indicator distinguishes between nominal interest rates (the gross interest rate) and real interest rates (adjusted for inflation), highlighting the purchasing power of money. It allows comparison of economic conditions between a main currency and a counterparty currency by plotting their respective inflation, nominal, and real interest rates over time. This helps identify trends and relative investment attractiveness; for example, a higher real interest rate in the main currency compared to the counterpart may indicate greater investment appeal.
Users input data such as inflation and nominal interest rates for each currency, which can be sourced from economic data websites like TradingEconomics.com. The tool supports informed decision-making in the forex market by providing a clear view of evolving economic factors affecting currency pairs.