
Dynamic Trend Flux
Indikator
Version 1.0, Nov 2025
Windows, Mac
4.0
Bewertungen: 1
Beschreibung
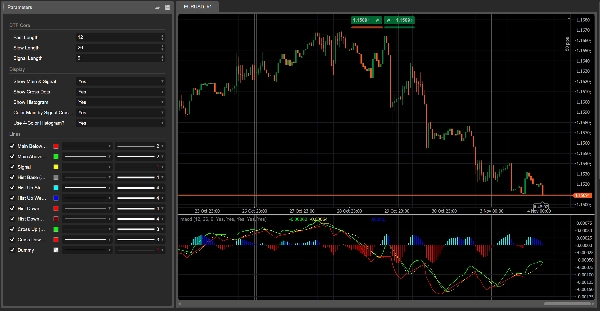
Dynamic Trend Flux
Typ: Momentum / Trend Oszillator (MACD-Stil, mehrfarbig)
Was es tut
Dynamic Trend Flux ist ein farbiger Momentum-Oszillator basierend auf der klassischen Differenz zwischen schneller/langsamer EMA plus einer Signallinie.
Er hilft Ihnen auf einen Blick zu erkennen:
- wann Momentum bullisch oder bärisch ist,
- ob das Momentum stärker wird oder nachlässt,
- und wo Trendwechsel stattfinden (Kreuzungen der Haupt- vs. Signallinie).
Der Indikator zeichnet:
- Hauptlinie (Flux-Linie)
-
- gebildet aus der Differenz zwischen einer schnellen und einer langsamen EMA
- ändert die Farbe je nachdem, ob sie über oder unter der Signallinie liegt (optional).
- Signallinie
-
- ein gleitender Durchschnitt der Hauptlinie, verwendet als sanfterer Auslöser.
- Histogramm mit 4 Farben (optional)
-
- zeigt den Abstand zwischen Haupt- und Signallinie,
- Farbe kodiert sowohl Richtung (über/unter Null) als auch Änderung der Stärke von Balken zu Balken.
- Punkte an Kreuzungen (optional)
-
- hervorhebt, wo die Hauptlinie die Signallinie kreuzt → potenzielle Trendphasenwechsel.
Alle Berechnungen werden im aktuellen Chart-Zeitrahmen durchgeführt.
Wie man es liest
1. Nulllinie
- Werte über Null → dominanter bullischer Druck.
- Werte unter Null → dominanter bärischer Druck.
2. Farbiges Histogramm
Mit 4-Farben-Modus AN:
- Aqua → über Null und steigend
-
- starkes / zunehmendes bullisches Momentum.
- Blau → über Null, aber fallend
-
- bullischer Trend noch aktiv, aber Momentum kühlt ab.
- Rot → unter Null und fallend
-
- starkes / zunehmendes bärisches Momentum.
- Dunkelrot → unter Null, aber steigend
-
- bärische Phase noch aktiv, aber Momentum verliert an Stärke.
Dies macht Divergenzen und Momentumwechsel visuell viel leichter erkennbar.
3. Haupt- & Signallinien
- Hauptlinie über Signal → bullische Phase.
- Hauptlinie unter Signal → bärische Phase.
Wenn Farbwechsel aktiviert ist:
- Hauptlinie Lime = über Signal (bullische Kontrolle)
- Hauptlinie Rot = unter Signal (bärische Kontrolle)
4. Kreuzpunkte
- Grüner Punkt (Cross Up) → Hauptlinie kreuzt über Signal
-
- möglicher Beginn eines bullischen Schwungs.
- Roter Punkt (Cross Down) → Hauptlinie kreuzt unter Signal
-
- möglicher Beginn eines bärischen Schwungs.
Kombinieren Sie diese Signale immer mit Struktur / Preisaktion und Kontext höherer Zeitrahmen.
Parameter (Englisch)
DTF Core
- Fast Length – Periode der schnellen EMA (Standard 12).
- Slow Length – Periode der langsamen EMA (Standard 26).
- Signal Length – Periode der Signallinie SMA, angewandt auf die Hauptlinie (Standard 9).
Anzeige
- Haupt- & Signallinie anzeigen – schaltet die beiden Linien ein/aus.
- Kreuzpunkte anzeigen – zeigt Punkte an Haupt-/Signal-Kreuzungen.
- Histogramm anzeigen – schaltet das Histogramm im Hintergrund ein/aus.
- Hauptlinie nach Signal-Kreuz einfärben?
-
- AN → Hauptlinie Lime über Signal, Rot darunter.
- AUS → Hauptlinie bleibt Rot.
- 4-Farben-Histogramm verwenden?
-
- AN → Aqua / Blau / Rot / Dunkelrot Logik.
- AUS → Histogramm ist einfarbig grau.
Zusammenfassung
Indikatorprofil
Kundenbewertungen
4.0
Bewertungen: 1
5 | 0 % | |
4 | 100 % | |
3 | 0 % | |
2 | 0 % | |
1 | 0 % |
Diskussion
Häufig gestellte Fragen (FAQ)
Signal
Indices
Commodities
GBPUSD
RSI
Bollinger
Fibonacci
Scalping
AI
XAUUSD
NAS100
MACD
BTCUSD
Forex
Breakout
EURUSD
NZDUSD
Martingale
Prop
ZigZag
Supertrend
Fair Value Gap
SMC
Crypto
Grid
Stocks
ATR
USDJPY
VWAP
Über den cTrader Store verfügbare Produkte, einschließlich Handelsbots, Indikatoren und Plugins, werden von externen Entwicklern bereitgestellt und nur zu Informations- und technischen Zugriffszwecken verfügbar gemacht. cTrader Store ist kein Broker und erbringt keine Anlageberatung, persönlichen Empfehlungen oder eine Garantie für zukünftige Performance.


Preis
42.11M
Gehandeltes Volumen
6.13M
Pip-Gewinn
222
Verkäufe
8.39K
Kostenlose Installationen