Opis
Bounty Killa – wskaźnik, który poluje na płynność stop-loss zanim zrobią to duzi gracze.
Bounty Killa to wskaźnik cTrader zaprojektowany dla traderów, którzy lubią handlować polowania na stopy / chwytanie płynności: świeczki, które wybiegają powyżej maksimów lub poniżej minimów, czyszczą stop lossy, a następnie odwracają się w przeciwnym kierunku.
Wskaźnik automatycznie skanuje każdą świecę i oznacza:
- SHS (Stop Hunt High) – prawdopodobne polowanie na stop lossy powyżej ostatnich maksimów → obszar do szukania sygnałów krótkich
- SHL (Stop Hunt Low) – prawdopodobne polowanie na stop lossy poniżej ostatnich minimów → obszar do szukania sygnałów długich
Logika wykrywania opiera się na:
- przebiciu ostatnich maksimów/minimów o co najmniej X pipsów,
- długim knocie wykraczającym poza ten poziom,
- małym korpusie i zamknięciu w przeciwnym kierunku do wybicia.
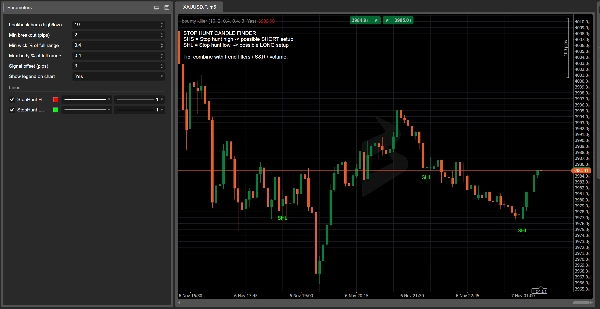
Koniec z domysłami „może to było polowanie na stopy”: Bounty Killer podświetla kluczowe świece bezpośrednio na twoim wykresie, z wyraźnymi etykietami, kolorami i legendą na wykresie.
Dlaczego traderzy to lubią:
- Pokazuje, gdzie rynek mógł złapać płynność i gdzie odwrócenie nabiera większego znaczenia.
- W pełni konfigurowalny: okno wstecznego przeglądu, minimalne wybicie w pipsach, procenty korpusu/knota, przesunięcie sygnału.
- Idealnie łączy się z klasycznym wsparciem/oporem, strefami podaży i popytu, wolumenem, blokami zleceń i koncepcjami SMC.
- Świetny dla traderów, którzy stosują ustawienia oparte na płynności, ale chcą czegoś obiektywnego i opartego na regułach zamiast czystego „na oko”.
⚠️ Bounty Killa nie jest pełnym systemem handlowym i nie otwiera ani nie zamyka pozycji.
Oznaczone świece to strefy o wysokiej wartości informacyjnej, które powinny być zintegrowane z twoją własną strategią, analizą trendu i zarządzaniem ryzykiem.
Bounty Killa – Szybki przewodnik użytkownika (EN)
1. Zalecane rynki i interwały czasowe
- Interwały czasowe: H1, H4, D1
(Niższe TF jak M1–M5 = dużo szumu, używaj głównie do nauki.) - Symbole: indeksy, FX, kryptowaluty, akcje, surowce – wszędzie tam, gdzie można podpiąć wskaźnik cTrader.
2. Jak czytać sygnały
- SHS – Stop Hunt High (czerwona etykieta nad świecą)
-
- Cena wybija się powyżej ostatnich maksimów, tworzy długi górny knot i zamyka się spadkowo.
- Pomysł: potencjalne ustawienie krótkie po fałszywym wybiciu i chwytaniu płynności powyżej maksimów.
- SHL – Stop Hunt Low (zielona etykieta pod świecą)
-
- Cena wybija się poniżej ostatnich minimów, tworzy długi dolny knot i zamyka się wzrostowo.
- Pomysł: potencjalne ustawienie długie po fałszywym wybiciu w dół i chwytaniu płynności poniżej minimów.
Bounty Killer nie mówi „kup/sprzedaj teraz”.
Podświetla strefy płynności, gdzie odwrócenie ma większy sens.
3. Sugerowane ustawienia bazowe
W parametrach wskaźnika:
- Liczba świec do analizy (high/low):
10–20
→ ile świec wstecz szukać ostatnich maksimów/minimów. - Min. wybicie (pipsy):
5–15pipsów
→ minimalna odległość poza maksimum/minimum, aby liczyć jako polowanie na stopy. - Min. procent knota względem całego zakresu:
0.60–0.70
→ co najmniej 60–70% świecy musi stanowić knot w kierunku polowania na stopy. - Max. procent korpusu względem całego zakresu:
0.25–0.35
→ mały korpus w porównaniu do całkowitego zakresu świecy. - Przesunięcie sygnału (pipsy):
3–5
→ tylko wizualne, przesuwa etykietę SHS/SHL lekko od świecy.
4. Prosta przykładowa strategia
Filtr trendu (EMA 200):
- Dodaj EMA 200 do swojego wykresu.
- Tylko krótkie pozycje:
-
- Cena jest poniżej EMA 200
- Otrzymujesz sygnał SHS (stop hunt high).
- Tylko długie pozycje:
-
- Cena jest powyżej EMA 200
- Otrzymujesz sygnał SHL (stop hunt low).
Pomysł na wejście:
- Poczekaj, aż świeca polowania na stopy się zamknie.
- Wejdź na następną świecę tylko jeśli cena potwierdzi:
-
- Dla SHS: następna świeca przebija minimum świecy SHS → rozważ krótką pozycję.
- Dla SHL: następna świeca przebija maksimum świecy SHL → rozważ długą pozycję.
Stop loss:
- Dla SHS (krótka) → SL tuż powyżej maksimum świecy SHS.
- Dla SHL (długa) → SL tuż poniżej minimum świecy SHL.
Take profit:
- Celuj w co najmniej 1:1.5 lub 1:2 R/R, lub
- Użyj pobliskich maksimów/minimów swingowych, wsparcia/oporu lub stref podaży/popytu jako celów.
5. Uwagi bezpieczeństwa i szybka lista kontrolna
Przed użyciem sygnału Bounty Killer zapytaj:
- Trend?
Czy sygnał jest zgodny z ogólnym trendem (EMA 200 / struktura rynku)? - Poziom?
Czy polowanie na stop lossy odbywa się na znaczącym poziomie (poprzednie maksimum/minimum, wsparcie/opór, maksimum/minimum sesji itp.)? - Kontekst?
Jakieś wiadomości, otwarcie/zamknięcie sesji, skoki zmienności? - Ryzyko?
Czy rozmiar stop lossa jest odpowiedni dla twojego zarządzania kapitałem (maksymalny % na transakcję)?
Jeśli 3–4 z tych punktów się zgadzają, SHS/SHL z Bounty Killa to nie tylko „ładna świeca”, ale strefa o wysokiej wartości, wokół której można budować pomysł na transakcję.
Podsumowanie
The detection criteria include a breakout beyond recent highs/lows by a configurable number of pips, a long wick extending beyond that level, a small candle body, and a close opposite to the breakout direction. Signals are displayed directly on the chart with clear labels and colors, supported by an on-chart legend.
Recommended for use on hourly to daily timeframes (H1, H4, D1) across various markets including forex, indices, cryptocurrencies, stocks, and commodities, Bounty Killa is fully customizable with parameters such as lookback period, minimum breakout size, wick and body proportions, and signal label offset.
The indicator highlights high-value liquidity zones to support trading decisions but does not execute trades. It is intended to be combined with other analysis tools like support/resistance, volume, order blocks, and trend filters (e.g., 200 EMA) for developing objective, rule-based liquidity-based trading setups.
Opinie klientów
5 | 50 % | |
4 | 50 % | |
3 | 0 % | |
2 | 0 % | |
1 | 0 % |


