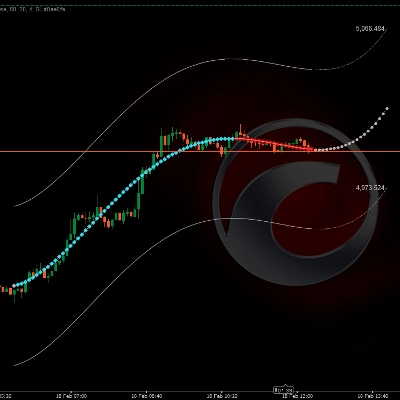
📊 Canal de Proyección de Precio Polinomial
https://chartshots.spotware.com/c/699603101593d
🔎 ¿QUÉ HACE?
https://chartshots.spotware.com/c/69960348da652
Ajusta una curva matemática sobre los últimos cierres de precio N y la extiende hacia el futuro como una proyección. Alrededor de esa curva dibuja un canal superior e inferior cuya anchura se adapta automáticamente a la volatilidad reciente del mercado.
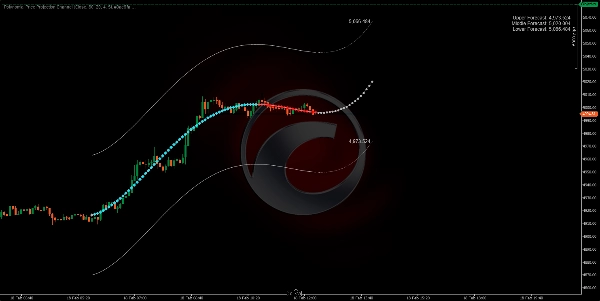
⚙️ ¿CÓMO FUNCIONA LA LÓGICA?
- Toma las últimas N velas (Barras de Retroceso) y calcula la curva polinomial que mejor se ajusta a esos precios usando mínimos cuadrados.
- Extiende la curva hacia adelante (Barras de Pronóstico) como una proyección matemática de la tendencia actual.
- Construye el canal desplazando la curva hacia arriba y hacia abajo usando el rango máximo de la vela del período analizado × 2.
https://chartshots.spotware.com/c/6996039a07e3a
🛠️ PARÁMETROS CLAVE
Parámetro
Predeterminado
Propósito
Barras de Retroceso
80
Cuántas velas históricas analiza
Barras de Pronóstico
20
Cuántas velas proyecta hacia adelante
Orden Polinomial
4
Flexibilidad de la curva (mayor = más curvas)
Entrada de Datos
Cierre
Precio base para el cálculo
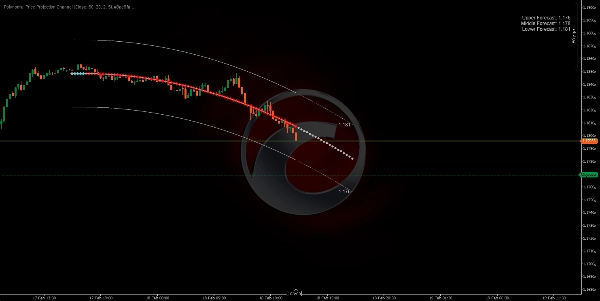
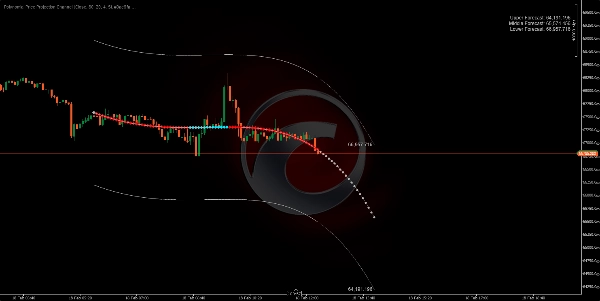
🎯 ¿CÓMO USARLO?
🟢 Compra Potencial → El precio toca la banda inferior y la proyección apunta hacia arriba.
🔴 Venta Potencial → El precio toca la banda superior y la proyección apunta hacia abajo.
⚠️ Confirma siempre con otros factores antes de operar. Este indicador es una extrapolación matemática, no una predicción garantizada.
5 | 0 % | |
4 | 100 % | |
3 | 0 % | |
2 | 0 % | |
1 | 0 % |


