present
Zarejestruj się i otrzymaj 50 $ zniżki na pierwszy zakup
Trading product for SMC_CHOCH_BOS Wskaźnik Key Levels MSS, image 1
SMC_CHOCH_BOS
Wskaźnik
Wersja 1.0, May 2026
Windows, Mac
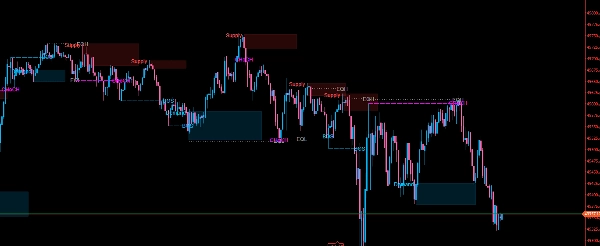
Trading product for SMC_CHOCH_BOS Wskaźnik Key Levels MSS, image 2
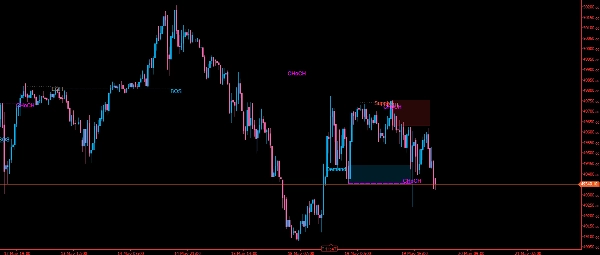
Trading product for SMC_CHOCH_BOS Wskaźnik Key Levels MSS, image 3
Od 21/02/2025
466.3M
Wolumen transakcji
180.83K
Zysk w pipsach
26
Sprzedaż
7.43K
Bezpłatne instalacje

Opis

SMC Ultimate Signals to wskaźnik Smart Money Concepts dla cTrader, który automatycznie identyfikuje kluczowe elementy struktury rynku bezpośrednio na Twoim wykresie.

Wykrywa Break of Structure (BOS) oraz Change of Character (CHoCH) poprzez śledzenie potwierdzonych swingowych szczytów i dołków — swing jest ważny tylko wtedy, gdy konfigurowalna liczba świec po obu stronach potwierdza pivot. Byczy BOS lub CHoCH występuje, gdy cena przebija ostatni swingowy szczyt; niedźwiedzi, gdy przebija ostatni swingowy dołek. Różnica między BOS a CHoCH zależy od aktualnego stanu trendu: przerwanie w kierunku trendu to BOS, przerwanie przeciwko niemu sygnalizuje CHoCH (odwrócenie trendu).

Wskaźnik oznacza również Równe Szczyty (EQH) oraz Równe Dołki (EQL) gdy dwa kolejne punkty swingowe mieszczą się w konfigurowalnej tolerancji pipsów, wskazując na pule płynności.

Strefy Podaży i Popytu są automatycznie rysowane wokół swingowego szczytu lub dołka, który wywołał przerwanie struktury. Możesz wybrać wyświetlanie tylko najnowszej strefy podaży i/lub popytu, aby utrzymać wykres w czystości, oraz opcjonalnie rozszerzyć wszystkie strefy do prawej krawędzi wykresu.

Kluczowe parametry:

  • Długość Swingu — potwierdzające świece po każdej stronie
  • Tolerancja EQ — odległość w pipsach dla wykrywania EQH/EQL
  • Maksymalna liczba świec — ograniczenie przetwarzania do ostatnich N świec dla wydajności
  • Przezroczystość i rozszerzenie stref — precyzyjne dostosowanie wyglądu wizualnego
  • Niezależne przełączanie BOS, CHoCH, EQH/EQL, stref i znaczników swingów

Podsumowanie

AI summary
SMC_CHOCH_BOS is a Smart Money Concepts indicator designed for the cTrader platform that automatically identifies key market structure elements on price charts. It detects Break of Structure (BOS) and Change of Character (CHoCH) by tracking confirmed swing highs and lows, where swings are validated by a configurable number of bars on each side. A bullish BOS or CHoCH occurs when price breaks above the last swing high; bearish signals occur when price breaks below the last swing low. The indicator distinguishes BOS and CHoCH based on the current trend state, identifying trend continuation or reversal accordingly.

Additionally, it marks Equal Highs (EQH) and Equal Lows (EQL) when consecutive swing points fall within a configurable pip tolerance, indicating potential liquidity pools. The indicator also automatically draws supply and demand zones around swing points that triggered structure breaks, with options to display only the most recent zones and extend them visually across the chart.

Key configurable parameters include swing length for pivot confirmation, equal high/low tolerance, maximum bars processed for performance, zone opacity and extension, and independent toggles for BOS, CHoCH, EQH/EQL, zones, and swing markers. The indicator provides visual signals to assist traders in analyzing market structure shifts and key levels.

Profil wskaźnika
Kategoria wskaźnika
Wsparcie i opór
Typ wyjścia
Wizualizacja
Wymagania dotyczące danych
Tylko słupki
Obsługiwane sygnały
Dotknięcie poziomu
Przebicie poziomu

Opinie klientów

0.0
Opinie: 0
Opinie klientów
Ten produkt nie ma jeszcze opinii. Wypróbowałeś(-aś) go już? Bądź pierwszy(-a) i powiedz o tym innym!

Dyskusja

Częste pytania

Key Levels
MSS
BOS
CHOCH
Market Structure
Supply & Demand
Produkty dostępne za pośrednictwem cTrader Store, w tym boty handlowe, wskaźniki i wtyczki, dostarczane są przez deweloperów zewnętrznych i udostępniane wyłącznie w celach informacyjnych oraz w celu zapewnienia dostępu technicznego. cTrader Store nie jest brokerem i nie zapewnia doradztwa inwestycyjnego, nie udziela spersonalizowanych rekomendacji ani nie gwarantuje przyszłych wyników.

Więcej od tego autora

Wskaźnik
RSI
Forex
+4
High-probability trading signals in the fast-paced world of forex and CFD trading.
Wskaźnik
Prop
Stocks
+4
High-Performance Renko Chart Indicator with Advanced filtering method - built for Renko and candlestick charts.
Wskaźnik
ATR
MSS
+5
Detects ICT Turtle Soup setups — liquidity sweeps with MSS confirmation, ATR filter & kill zone session filter.
Wskaźnik
SMC
Prop
+15
Automatic Elliott Wave Detection with Professional Filters
Wskaźnik
Fibonacci
Key Levels
DailyTargets: Dynamic ADR-based levels & targets. Includes Buy/Sell zones, previous Hi/Lo, and automated trend alerts.
Wskaźnik
EMA
RSI
+2
Advanced TDI indicator with Shark Fin signals, chart arrows, MTF RSI, divergence detection and smart alerts.
Wskaźnik
Key Levels
Order Block
+3
Marks NY session range, detects wick sweeps beyond box edges.. One signal per day. Overlay, no repainting!
Wskaźnik
MACD
Key Levels
+2
Trend indicator with multi-timeframe filters, generating signals only on fully completed bricks & candles. No Repaint.
Wskaźnik
Key Levels
Supertrend
+3
Marks London and New York session opening zones and alerts you instantly on breakouts.
cBot
EMA
SL Manager
+5
Fully automated dual-symbol hedging cBot for cTrader.
20.6%
ROI
8.66
Współczynnik zysku
Wskaźnik
BOS
Fair Value Gap
+1
ICT Quarterly Theory indicator — color-coded Q1–Q4 session zones with smart entry signals and real-time alerts.
cBot
RSI
Aggressive
automates entries based on the RSX indicator — a smoothed, low-lag variant of the classic RSI.
1.67
Współczynnik zysku

Możesz także polubić

Wskaźnik
ATR
Prop
+14
Optimize exits with Chandelier Exit! Visualize stop-loss points dynamically for improved trading precision and safety.
Wskaźnik
Forex
Crypto
+5
📈 Initial Balance Breakout Signals: visually accurate IB levels, breakout alerts & forecast zones for smart trading.
Wskaźnik
EMA
RSI
+2
Advanced TDI indicator with Shark Fin signals, chart arrows, MTF RSI, divergence detection and smart alerts.
Wskaźnik
Forex
Flexible Volume Profile, designed with performance in mind.
Wskaźnik
ATR
VWAP
+4
Structure-aware indicator that re-anchors VWAP to confirmed swing pivots.
Wskaźnik
Forex
EURUSD
+8
This indicator plots the 15m opening range of the NY session with the first N FVGs presented on the chart after the open
Wskaźnik
ATR
CCI
+4
A trend line that never steps back, a shaded band to the price, and a pointer at the swing where the trend turns.
Logo „ATR Bands”
Popularne
4.7
(4)
$19
Wskaźnik
ATR
Prop
+13
Enhance trading with ATR Bands! Visualize market volatility using dynamic upper and lower ATR bands for precise decision
Wskaźnik
ATR
RSI
+14
A metric that can set 1 to 3 groups of Bollinger Bands
Wskaźnik
ADX
ATR
+5
EMA-cross signals scored on six confluence layers, with an ATR stop, three targets and a live panel
Wskaźnik
Channel
Imbalance
+2
Adaptive volatility channel based on moving average and standard deviation (σ).
Wskaźnik
SmartFibonacci — automatic Fibonacci retracements & extensions with swing detection, alerts and clean labels for cTrader
Wskaźnik
Forex
NAS100
+3
volumen perfile
Wskaźnik
ATR
EMA
+2
Eight-EMA ribbon with ATR trade zones, a nine-symbol screener and a five-timeframe trend dashboard.
Wskaźnik
MSS
Volume
+3
Rejection-based volume profile with tiered heat zones, POC levels and a fully draggable anchor on cTrader.
Wskaźnik
Alpha Sentiment Pro - See the Market's Pulse Before It Moves
Wskaźnik
RSI
MACD
Unlock market insights with our Multi-Timeframe Market Levels indicator, enhancing your trading strategies effortlessly
Wskaźnik
ATR
EMA
+3
EMA cross filtered by a trend average and its ATR channel, with long, short and close marks and colored candles.

Cena

Od 21/02/2025
466.3M
Wolumen transakcji
180.83K
Zysk w pipsach
26
Sprzedaż
7.43K
Bezpłatne instalacje