

Beschreibung
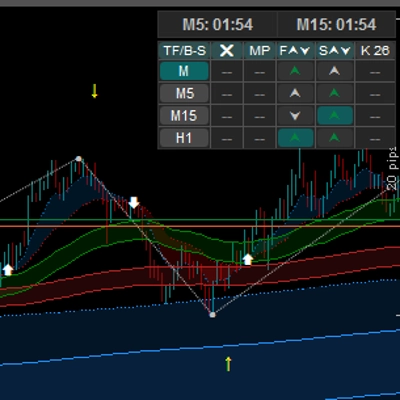
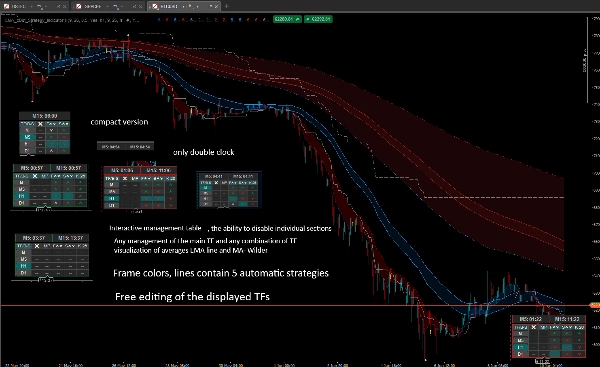
Das ultimative MTF Trend- & Momentum-Dashboard ist eine fortschrittliche Analysesuite, die entwickelt wurde, um „Chart-Chaos“ zu beseitigen und Ihnen gleichzeitig institutionelle Marktkontexte zu bieten. Durch die Aggregation kritischer Daten aus mehreren Zeitrahmen in einem schlanken, interaktiven On-Chart-Panel ermöglicht es Ihnen, Handelsentscheidungen schneller und mit höherem Vertrauen zu treffen. Egal, ob Sie ein Scalper im niedrigeren Zeitrahmen oder ein täglicher Swing-Trader sind, dieses Tool liefert präzise Einblicke in die Trendstärke, potenzielle Rücksetzer und wichtige strukturelle Niveaus. Indikator, der entwickelt wurde, um halbautomatische Trades manuell oder mit einem Bot einzugehen https://ctrader.com/products/3618
Gibt es eine Möglichkeit, TF und jede Kombination von TFs der angezeigten Durchschnitte anzuzeigen – anders als der aktuelle TF auf cTrader?
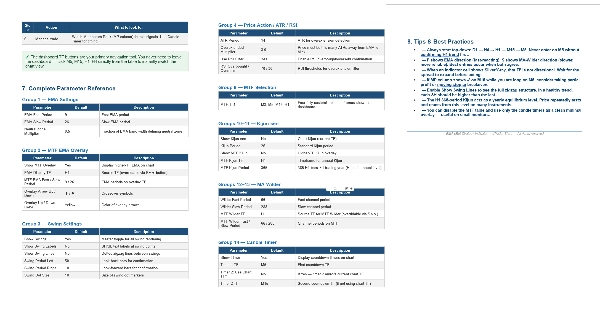
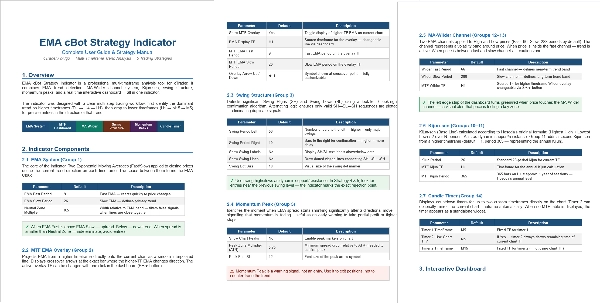
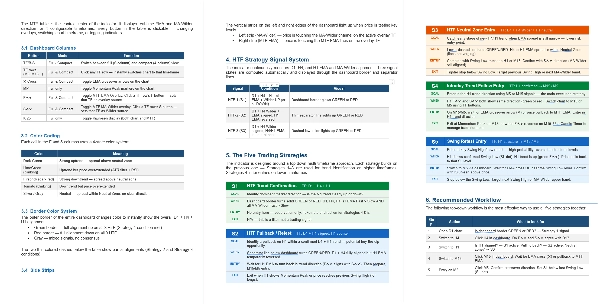
Anleitung - https://clogic-algo.github.io/EMA_cBot_Strategy_Guide/EMA_Strategy_Guide.html
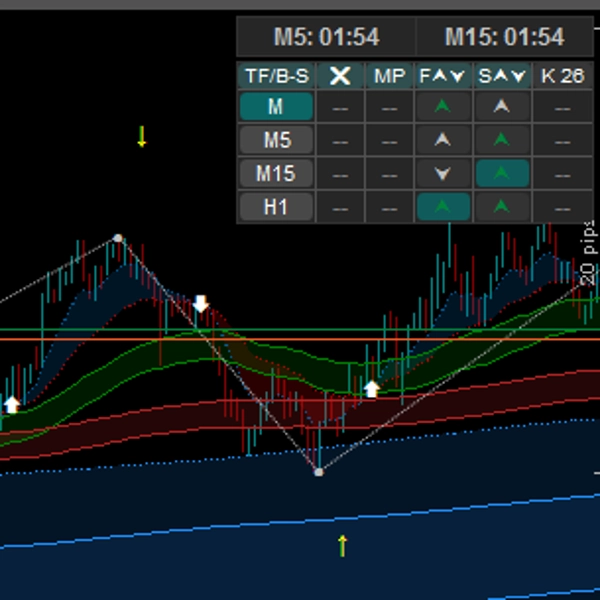
1. Interaktives Multi-Timeframe (MTF) Dashboard
- Überwachen Sie bis zu 4 Zeitrahmen (z. B. M1, M5, H1, D1) gleichzeitig in einem sauberen UI-Panel.
- Klickbare Benutzeroberfläche: Ändern Sie den Zeitrahmen Ihres Charts sofort, indem Sie einfach die Schaltflächen im Dashboard anklicken!
- Kompakt- / Vollmodi: Wechseln Sie die Größe des Dashboards, um erweiterte Metriken (EMA, Wilder, Kijun und Momentum-Signale) anzuzeigen oder auszublenden und so Bildschirmplatz zu sparen.
- HTF-Ausrichtungsrahmen: Der Rahmen des Dashboards ändert dynamisch die Farbe, um Sie zu warnen, wenn höhere Zeitrahmen (H1, H4, D1) vollständig ausgerichtet sind.
2. Automatische Marktstruktur (Swing High / Swing Low)
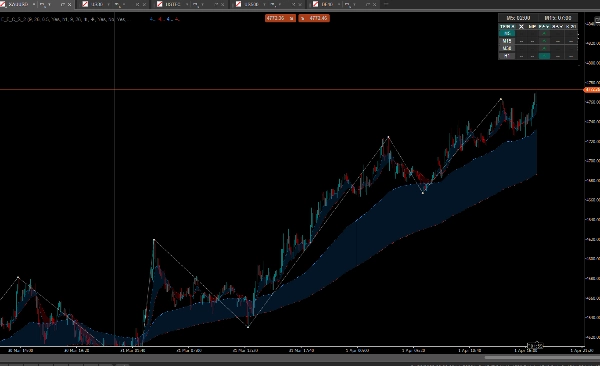
- Erkennt und markiert automatisch Wendepunkte (Swing Highs / Lows) mit visuellen Punkten und Textbeschriftungen.
- Optionales Zeichnen von Swing-Linien (Zig-Zag-Stil), um Marktbewegungen und Strukturbrüche leicht zu visualisieren.
- Volle Kontrolle über die Swing-Empfindlichkeit (anpassbare Lookback-Perioden für linke/rechte Balken).
3. Erweiterte gleitende Durchschnitte & Trendwolken
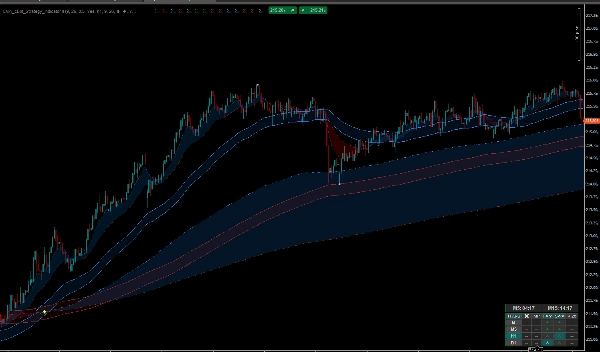
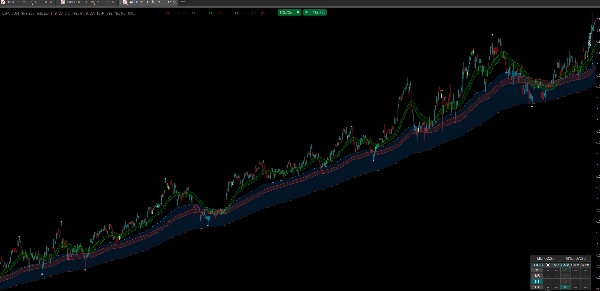
- Visualisieren Sie die Trendrichtung mit transparenten „Wolken“, die zwischen schnellen und langsamen gleitenden Durchschnitten (EMA & MA-Wilder) dargestellt werden.
- Echte MTF-Overlays: Zeichnen Sie EMAs höherer Zeitrahmen (z. B. 1-Stunden-EMA) direkt in Ihren aktuellen niedrigeren Zeitrahmen-Chart (z. B. 5-Minuten) glatt und ohne Verzerrung ein.
- Eingebaute visuelle Pfeile und Warnungen für EMA-Kreuzungen.
4. Trenderschöpfung & Momentum-Peaks
- Verwendet einen intelligenten Algorithmus kombiniert mit ATR- und RSI-Filtern, um zu erkennen, wann der Preis stark überdehnt ist.
- Momentum-Peaks: Der Indikator analysiert die „Spanne“ zwischen schnellen und langsamen Durchschnitten. Wenn ein starker Momentum-Schub endet und die Durchschnitte sich zu verengen beginnen, zeigt er einen spezifischen „Peak“-Warnpfeil an – ein ausgezeichnetes Werkzeug, um Rücksetzer und Take-Profit-Zonen zu erkennen.
5. Ichimoku-Unterstützung (Kijun-sen)
- Schalten Sie eine klassische Kijun-sen-Linie ein, die als dynamische Unterstützung/Widerstand fungiert.
- Beinhaltet eine MTF-Kijun-Option, um die Baseline eines höheren Zeitrahmens in Ihrem aktuellen Chart anzuzeigen.
6. Edge-Statusstreifen & Dualer Kerzen-Timer
- Diskrete, farbcodierte „Edge-Strips“ (Striche) neben dem Dashboard geben Ihnen eine sofortige visuelle Anzeige der Trendrichtung höherer Zeitrahmen, damit Sie nicht gegen den Makrotrend handeln.
- Eingebauter dualer Countdown-Timer, der gleichzeitig die verbleibende Zeit für die aktuelle Kerze UND eine Kerze eines höheren Zeitrahmens (z. B. M5 und H1) anzeigt.
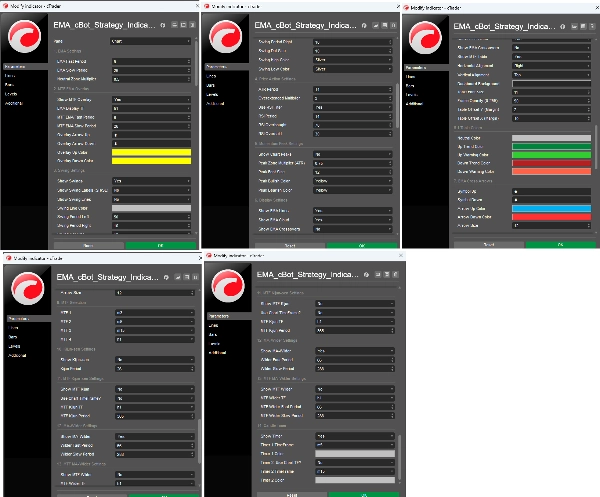
⚙️ Ultimative Anpassung:
Dieser Indikator wurde entwickelt, um sich an Ihre Strategie anzupassen. Sie haben die volle Kontrolle über:
- Perioden und Parameter aller gleitenden Durchschnitte (EMA, Wilder, Kijun).
- Vollständige UI-Farbgestaltung (Wolken, Panel-Hintergrund, Text, Trendwarnungen).
- Positionierung des Dashboards (Links/Rechts, Oben/Unten), Ränder und Transparenz.
- ATR- und RSI-Filter-Schwellenwerte zur Eliminierung falscher Signale.
Für wen ist dieser Indikator geeignet?
- Trendfolger, die ihre Einstiege mit dem Momentum höherer Zeitrahmen abstimmen möchten.
- Price-Action-Trader, die auf eine genaue Swing High/Low-Marktstruktur angewiesen sind.
- Daytrader & Scalper, die eine konstante Übersicht über H1/H4/D1-Trends benötigen, ohne ihren Arbeitsbereich mit mehreren Fenstern zu überladen.
Optimieren Sie Ihren Bildschirmplatz und gewinnen Sie einen enormen Vorteil mit echtem Multi-Timeframe-Kontext. Installieren Sie das Dashboard noch heute und passen Sie es perfekt an Ihren Handelsstil an!
Zusammenfassung
Key features include visualization of trend direction through transparent clouds between fast and slow moving averages (EMA and Wilder MA), true MTF overlays that plot higher timeframe EMAs on lower timeframe charts without distortion, and built-in alerts for EMA crossovers. It incorporates a smart algorithm with ATR and RSI filters to detect trend exhaustion and momentum peaks, signaling potential pullbacks or take-profit zones.
The indicator also supports Ichimoku Kijun-sen lines as dynamic support/resistance, with multi-timeframe options. Additional tools include color-coded edge status strips indicating higher timeframe trend bias and a dual candle countdown timer for current and higher timeframe candles.
Users have full customization over moving average parameters, UI colors, dashboard positioning, and filter thresholds. This tool suits trend followers, price action traders, day traders, and scalpers seeking institutional-grade multi-timeframe market context in a streamlined interface.





























