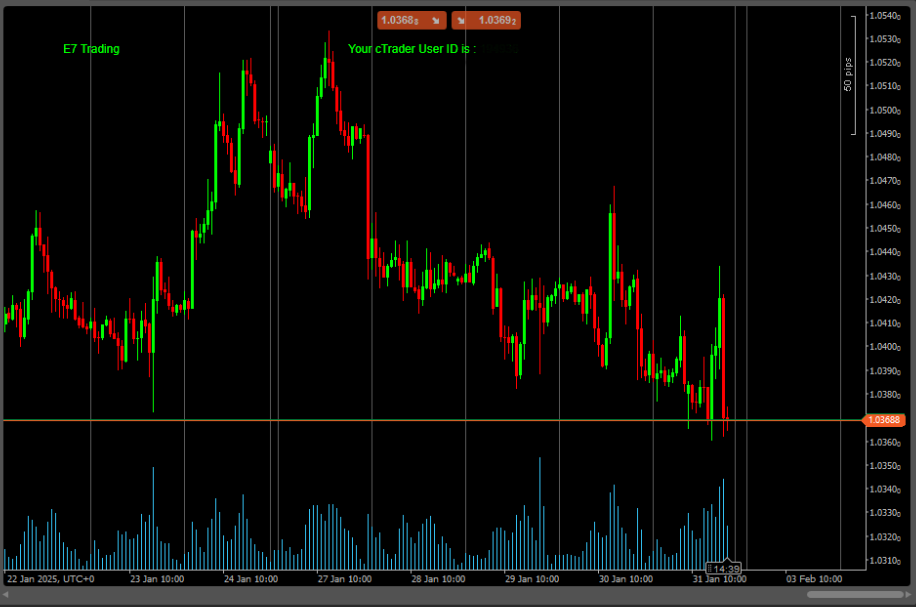
Ctrader Liniar Chart
"Ctrader Liniar Chart" logo
03/09/2025
Desktop
Since 28/01/2025
Sales
3
Free installs
99
"Ctrader Liniar Chart" uploaded image"Ctrader Liniar Chart" uploaded image"Ctrader Liniar Chart" uploaded image


Trend Visual:


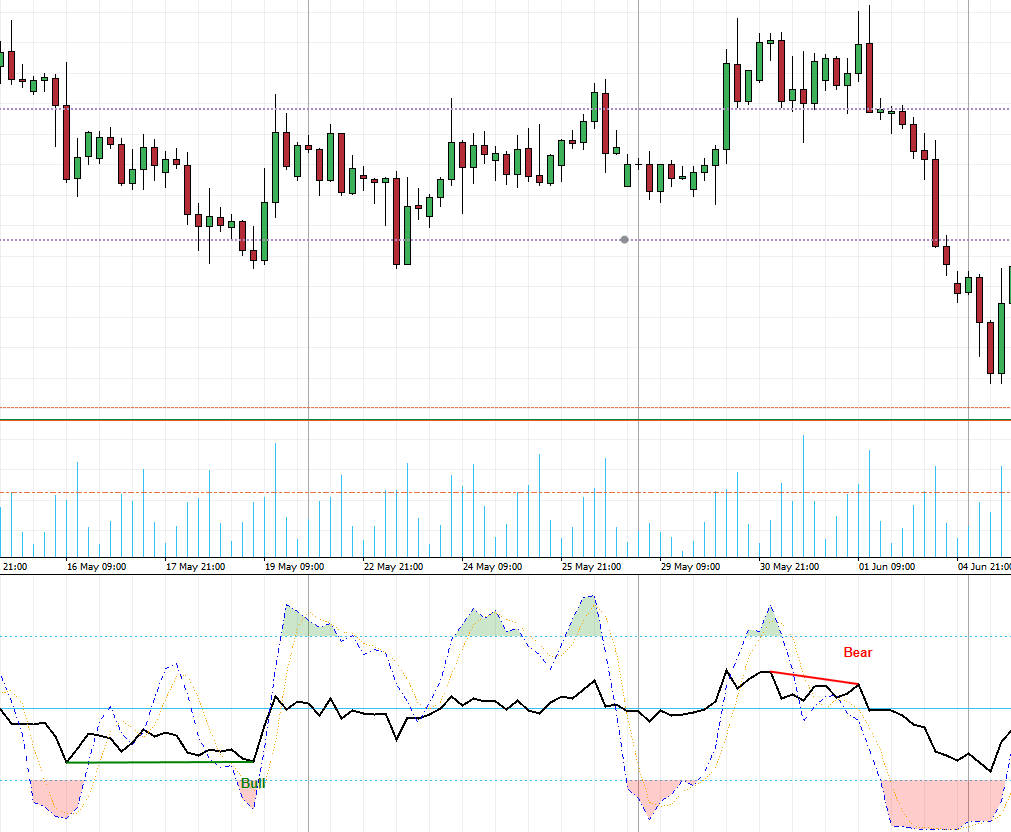
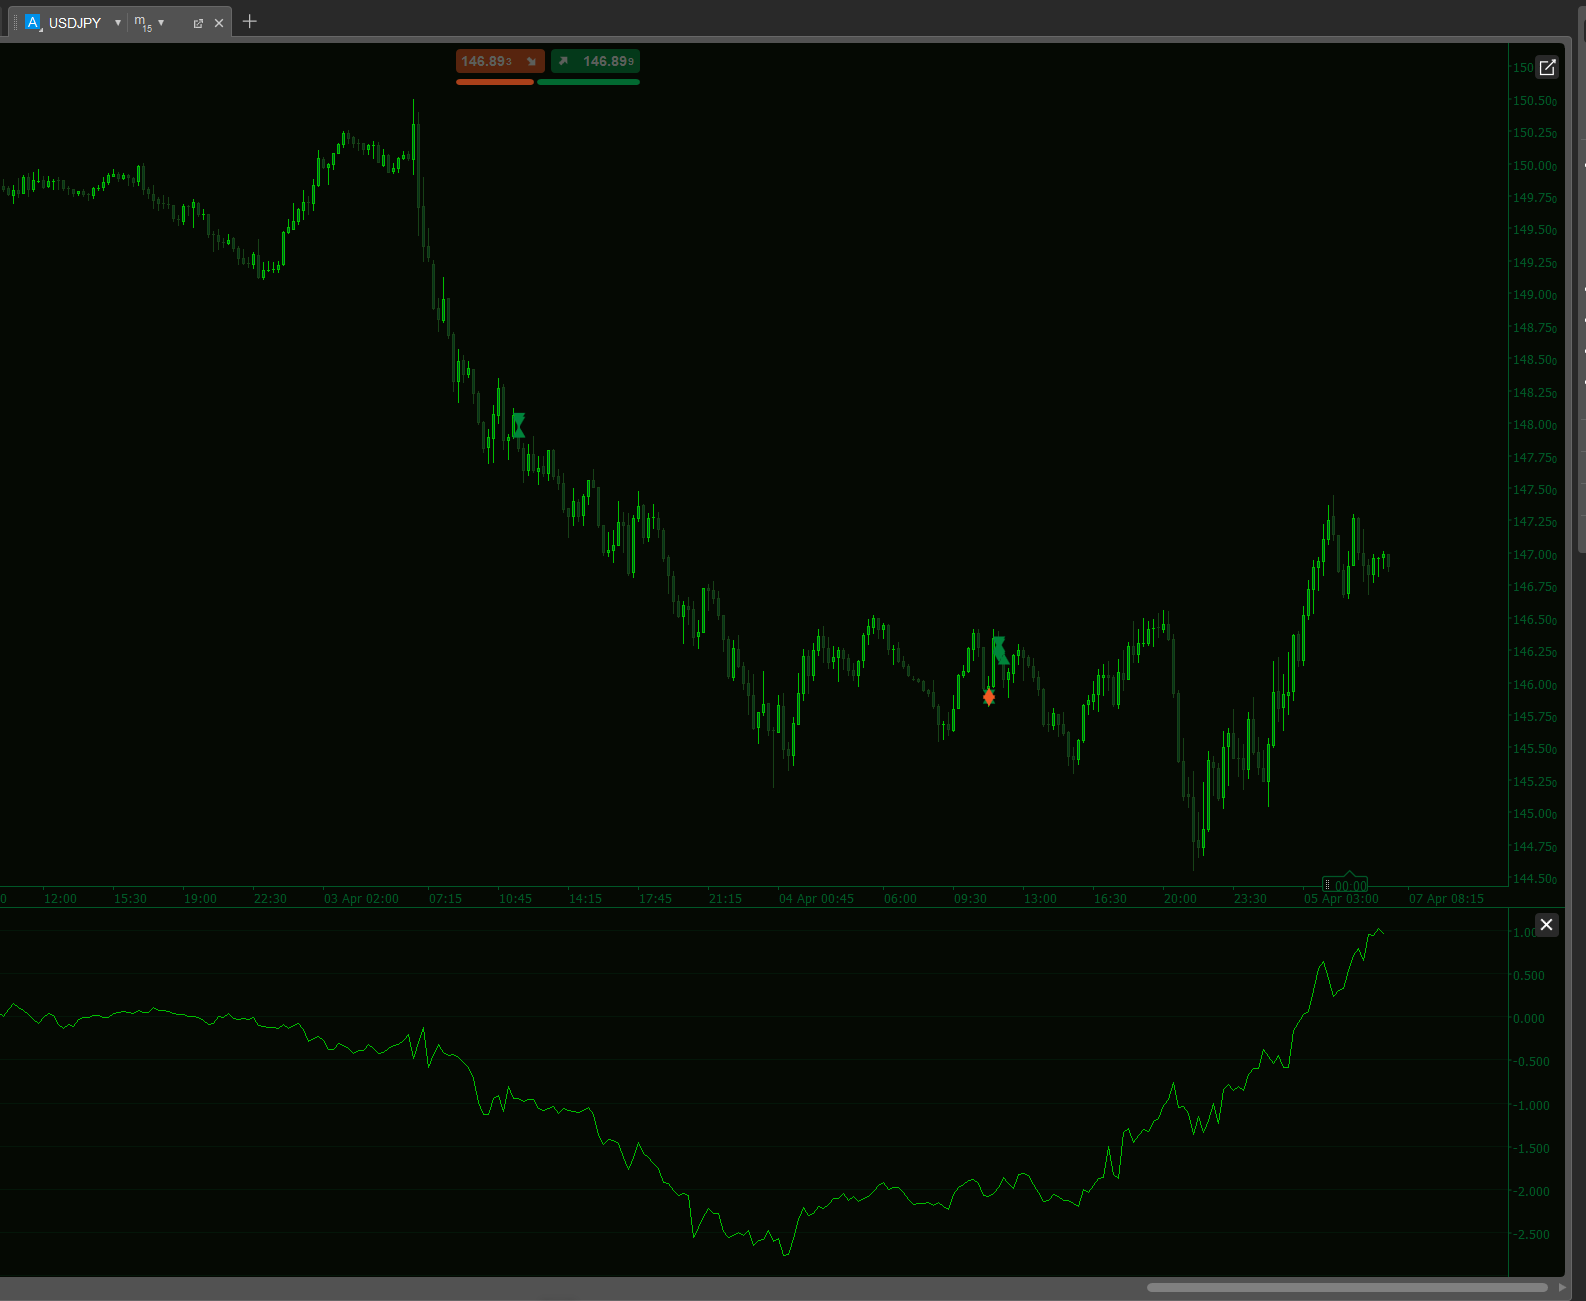
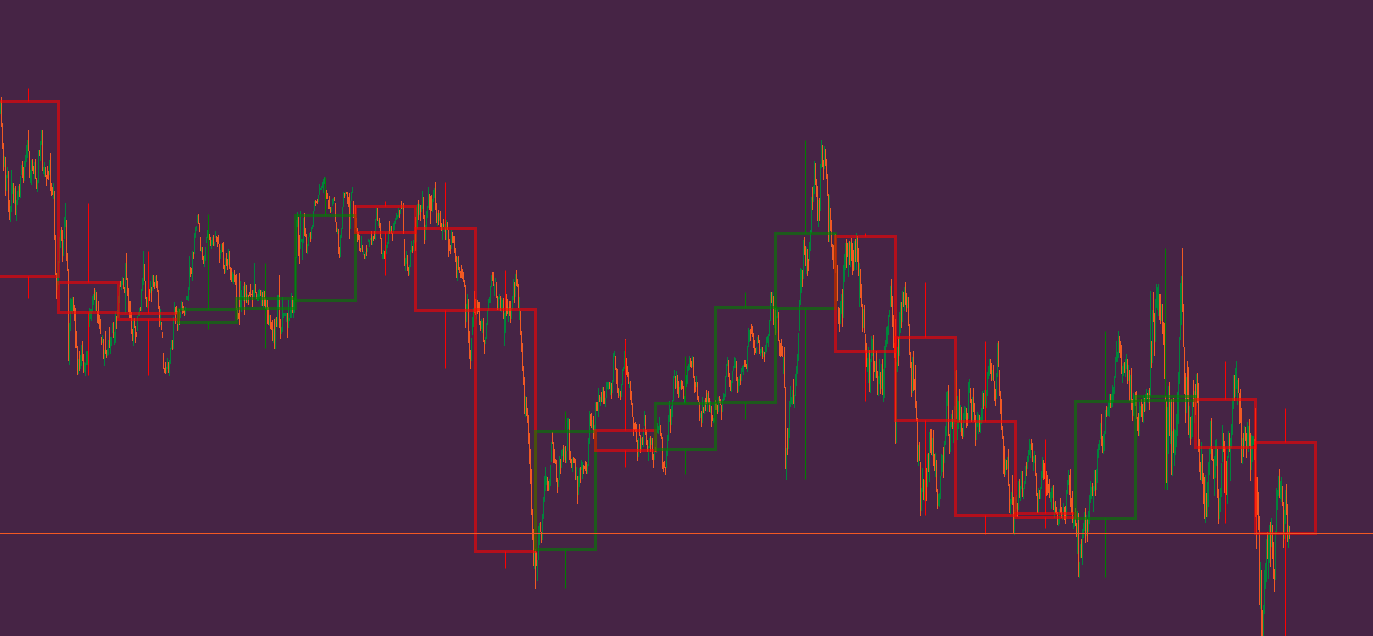
Draws trend lines (green for uptrend, red for downtrend) based on price direction changes

Plots a yellow price line on the chart

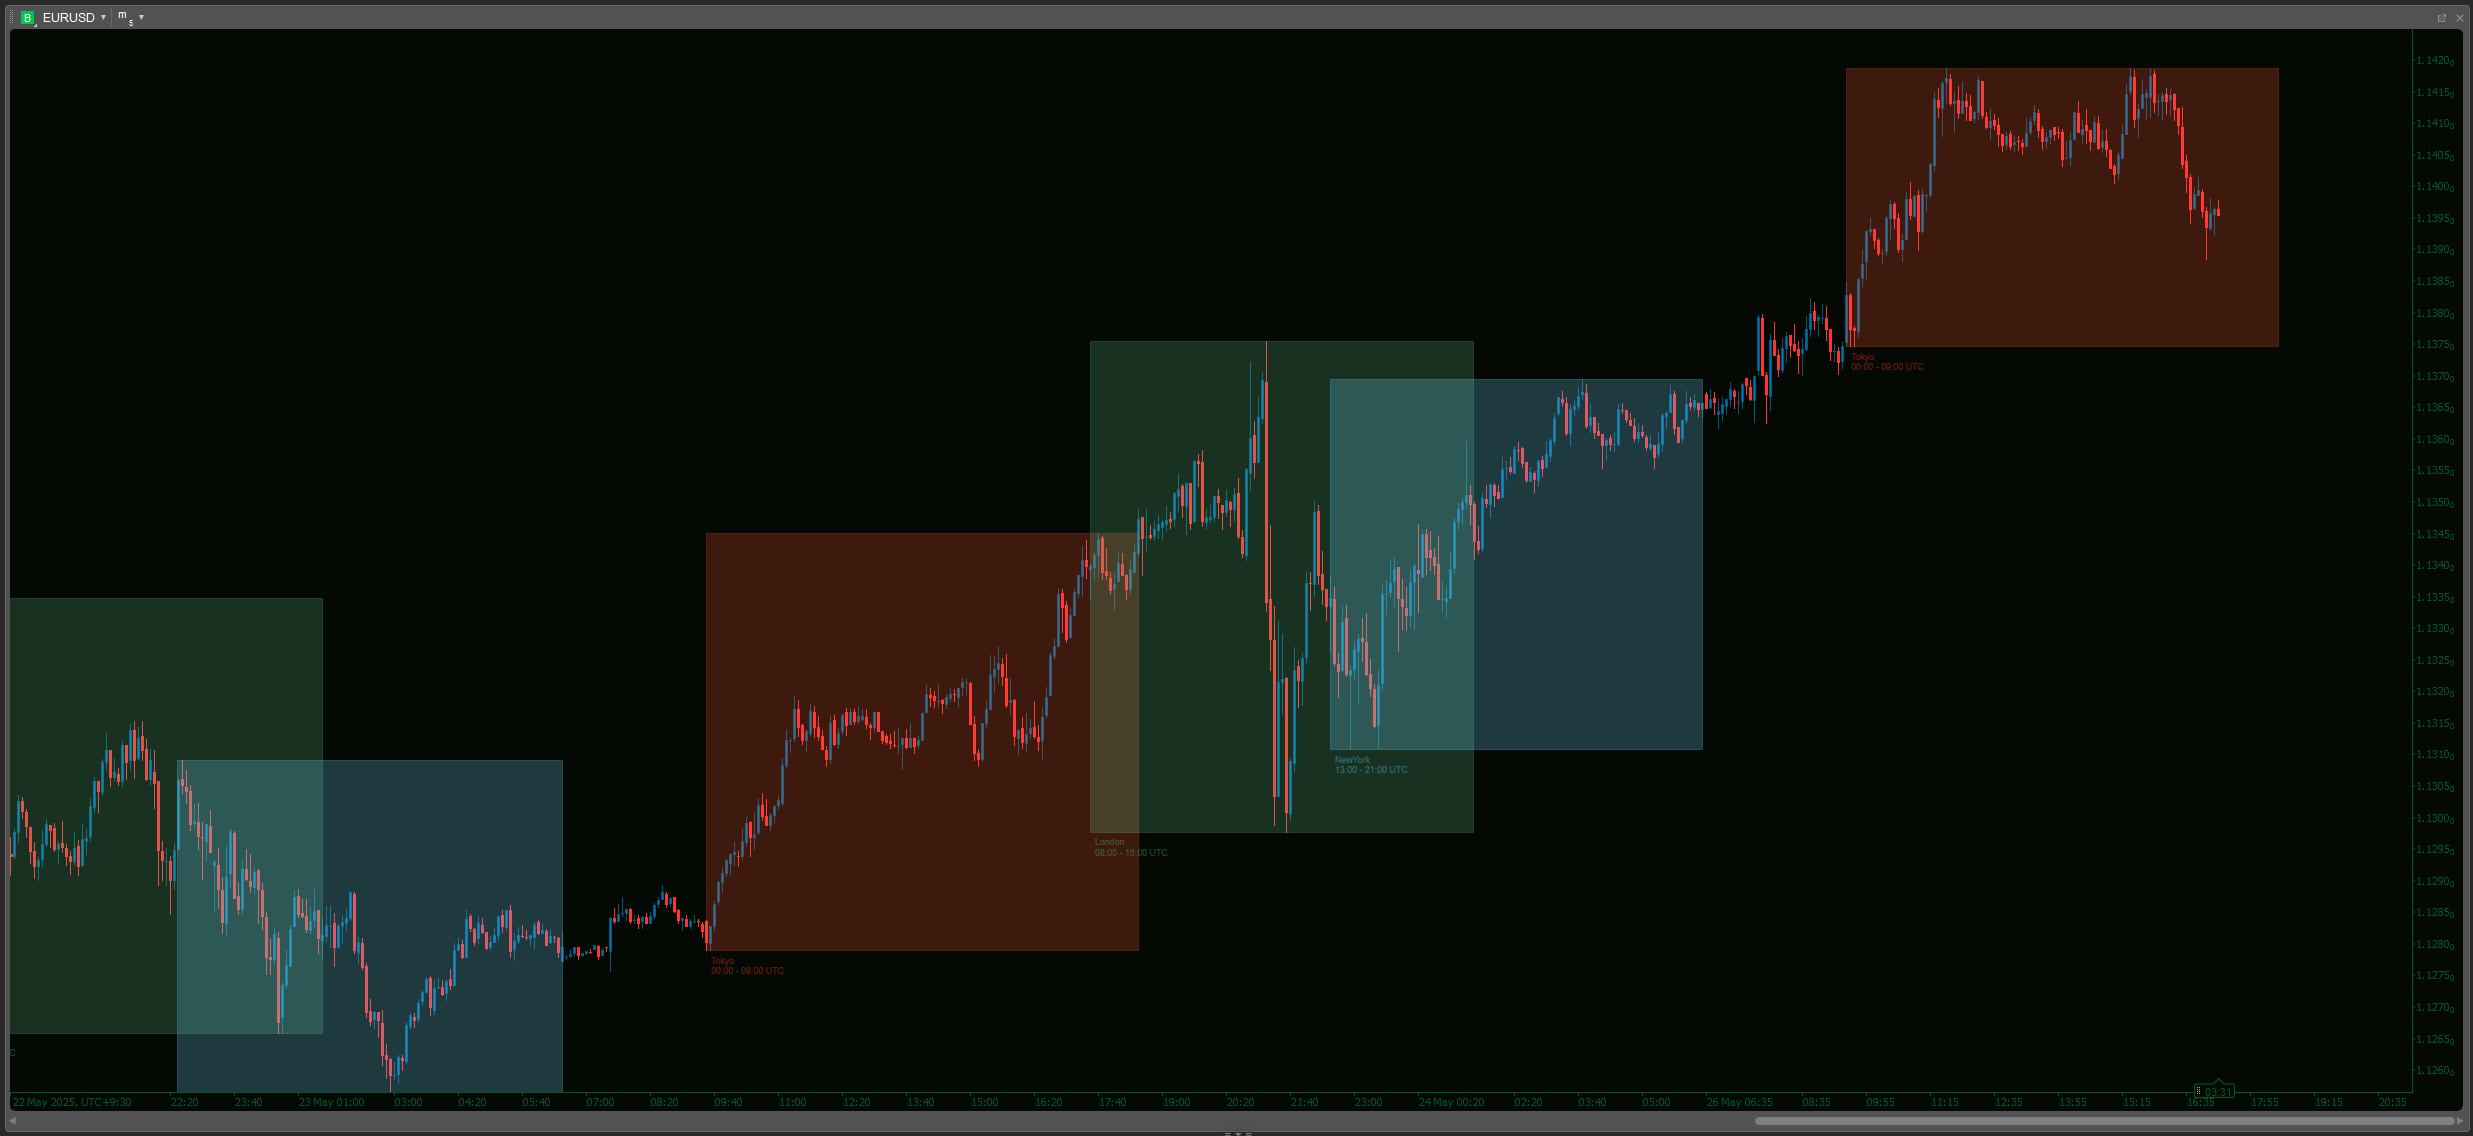
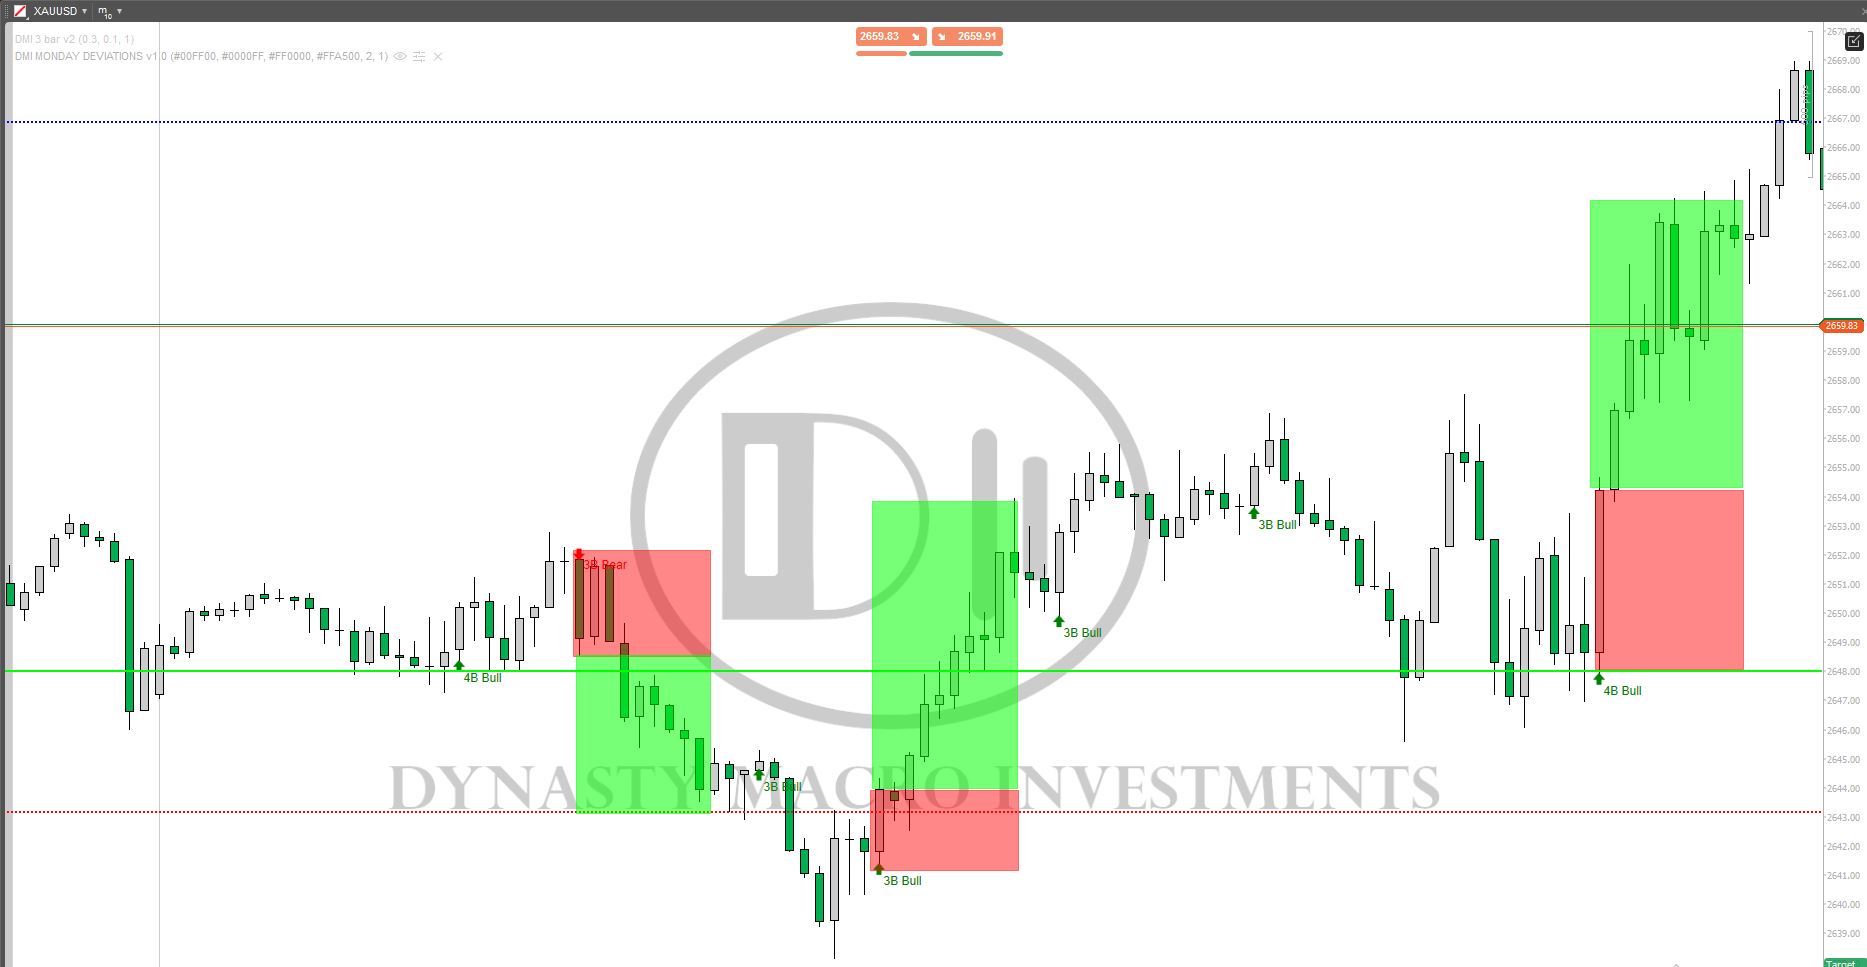
Support/Resistance Zones:

Configurable support and resistance levels with adjustable thickness (in pips)

Custom colors and opacity for the zones

Interactive zones that can be manually adjusted on the chart


Alert System:


Trend change alerts (when price direction changes)

Support/resistance zone hit alerts

Custom sound alerts for different events

Auto Support/Resistance:

Optional automatic adjustment of support/resistance levels when trends change
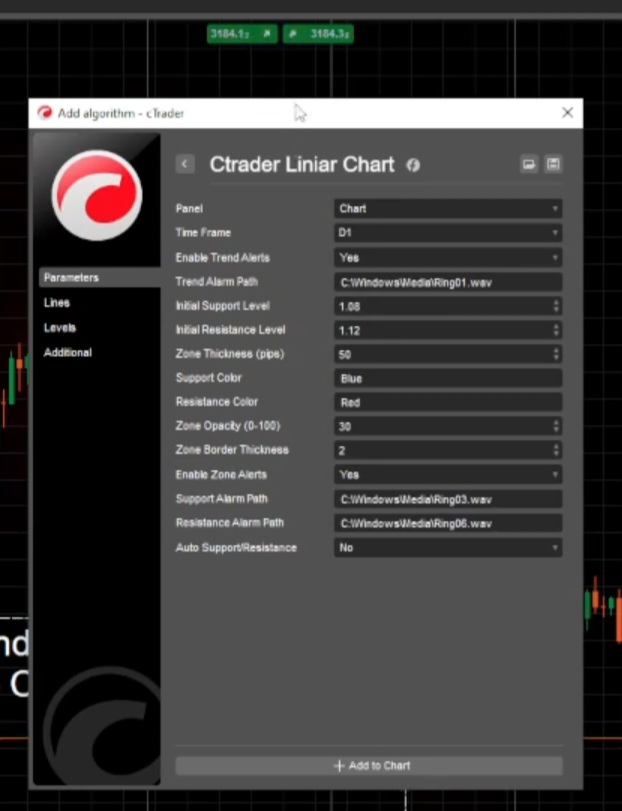

How It Works

Sets up the selected time frame (default is Daily)

support/resistance levels with default or user-defined values

Starts a timer to periodically check for zone adjustments


Calculation Logic

For each bar, it compares the current close price with the previous close price

Determines the current trend direction (up/down)

Draws a trend line between the current and previous prices

If the trend direction changes:

Optionally updates support/resistance levels automatically

Triggers trend alerts (if enabled)

Checks if price enters support/resistance zones and triggers alerts accordingly

Zone Management

Support/resistance zones are drawn as semi-transparent rectangles

Zones can be manually adjusted on the chart and the indicator will track these changes

Zone thickness is configurable in pips

Alert Types

Trend Alerts: Triggered when price changes direction (up/down)

Zone Alerts: Triggered when price enters support/resistance zones

Auto-Level Alerts: When auto-support/resistance is enabled, alerts when these levels are automatically adjusted

Time frame selection

Enable/disable different alert types

Custom sound file paths for different alerts

Support/resistance level .

More from this author
Renko 4k Pips
Custom your Renko Brick how do you wish!
Indicator
RSI
ATR
Signal
+1
Trading Fusion Bars 2
This indicator works best as a trend-confirmation tool—wait for multiple signals!
Bars color 1
This is the first version I offer you for free.
Ctreder Smart SMA Indicator
cTreder Smart SMA
Indicator
Indices
Stocks
Forex
+1
Bullet Chart Trend
Unique Pyramid Design , Clear Price Action Trend
Candelstick xxl
The indicator is designed to detect aggressive movements in the market and without volume for trend changes.
Indicator
Signal
Trend Bars Color
New Trend whit buy-sell signal
Big Candel
1 Candel High Time Freme
Renko Line Chart
Smart Signal Reversal Trend + Patterns
Indicator
Indices
Stocks
Forex
+1
Bullet Chart
✅ Unique Design. ✅ Works on All Time frames
You may also like
Indicator
Indices
RSI
XAUUSD
+9
RT Stochastic RSI PRO
Unlock Stochastic RSI PRO in cTrader! Overlay RSI, highlight zones, and identify divergences with customizable settings.
Indicator
Indices
Forex
Signal
+2
US Dollar Index
US Dollar Index
Bars color 1
This is the first version I offer you for free.
Indicator
Grid
RSI
Breakout
+6
Final Stochastic Oscillator
Final Stochastic Oscillator is a next-generation upgrade of the classic stochastic indicator
Pivot Point Super Trend
Laser entries with pivot confirmation. No repaint, all timeframes. Professional results.
Indicator
VWAP
XAUUSD
Forex
+2
Dynamic Swing Anchored VWAP
Vishal Volume Profile v2.0
Volume Profile plots traded volume at each price level, highlighting high activity zones of precise support & resistance
Indicator
Prop
Forex
MM-Symbol Info (Pro)
NEW - PNLs as % - daily, weekly, monthly, or yearly & Spread, Time To Close, PNL Alerts, custom Bid / Ask lines
MTF Candle Countdown
Stay ahead with a real-time countdown to candle closes on all key timeframes: 5m, 15m, 30m, 1H, 4H, and Daily.
Indicator
Signal
FAMA-MAMA
The FAMA-MAMA Indicator is a powerful, adaptive trend-following tool designed for professional and algorithmic traders.
Market Sessions V2_NSC
Market Session V2: Full Control. colors, history, session/text toggles, font size. Elevate your strategy!
DMI 3 bar v2
Shows BUY & SELL signals for 3 & 4 BAR PATTERN (Morning star/ Evening star). It is adjustable and it will SHOW ARROWS.
HTFOverlayPlus
HTFOverlayPlus
Market Sessions Advanced
Advanced Market Sessions with ICT killzones
Indicator
NAS100
NZDUSD
Martingale
+22
Indicators Volume Profile 1
Taiz Pro Volume Profile مؤشر احترافي لتحليل الحجم (Volume Profile) يكشف عن مناطق الدعم والمقاومة الحقيقية التي يركز عليه
Indicator
VWAP
RSI
Stocks
+2
Market Cipher B
Market Cipher B
Indicator
Indices
XAUUSD
Breakout
+9
Market Bias Gauge
Measure Market Strength at a Glance – Instantly
E7 cTrader User ID
cTrader ID