MARKET STRUCTURE INDICATOR
What’s the Big Idea?
This indicator isn't just drawing lines on your chart—it’s trying to understand the real mood of the market. It tracks where price momentum actually shifts, not just random wiggles. That’s where real turning points happen.
Swing Highs & Lows – The Market’s Mood Swings
Every time the price shifts direction with conviction, the indicator marks it. These aren’t just random bounces—they’re genuine swing highs and lows, backed by strong momentum. These are the moments that matter.
Pivot Zones – Not Just Lines, but Stories
When a swing is found, it creates a pivot zone—like a mini battlefield where buyers or sellers showed up with real strength. These zones show where price has already proven itself. Think of them as memory spots on your chart.
Stronger Together – Zone Merging
When multiple pivots overlap, the indicator merges them into stronger, more meaningful zones. These stacked areas are where the market has drawn a line in the sand—places that get retested, respected, or broken with force.
Stay in Sync with the Market
When price clearly breaks through one of these zones, the indicator updates its bullish or bearish bias. It even lets you know with optional sound alert. You’ll never miss a structure shift again—unless you want to.
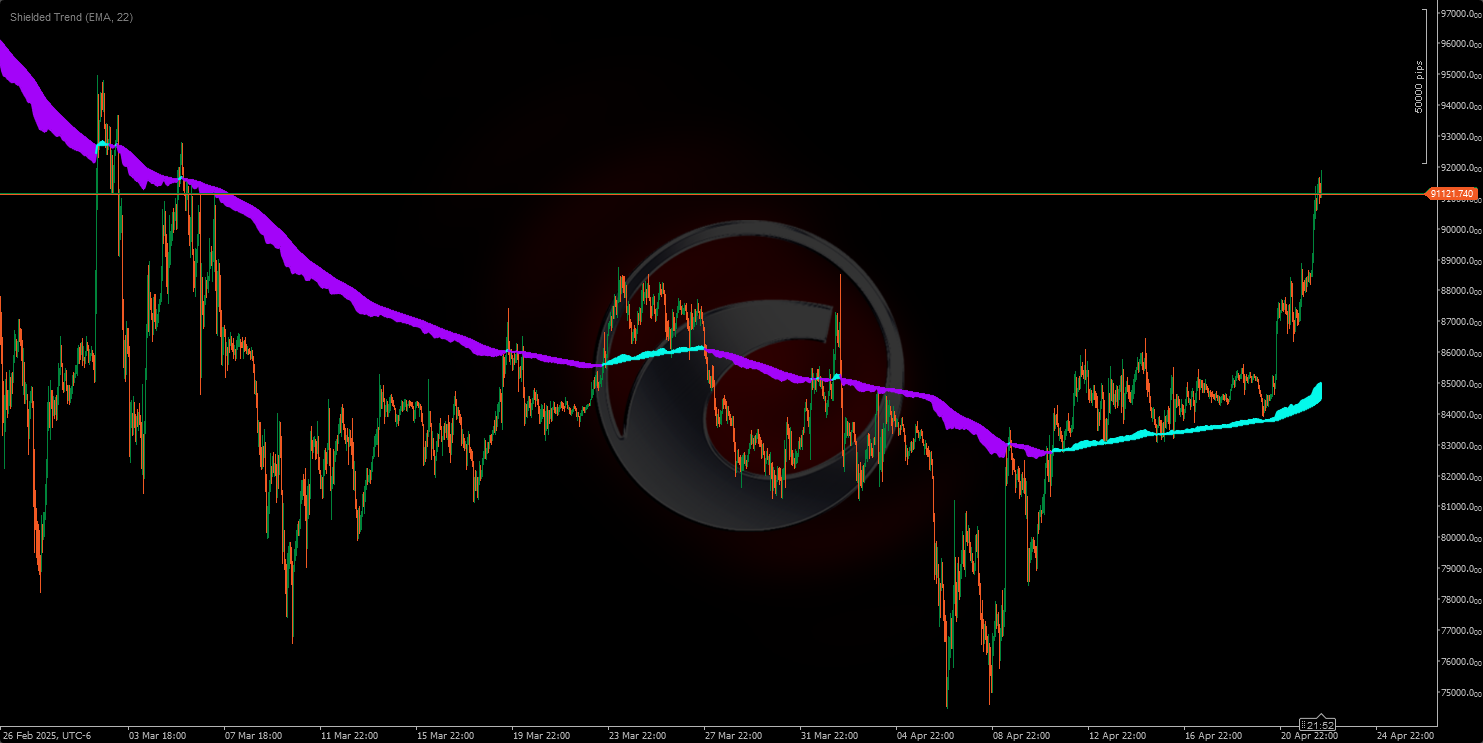
Works on Any Timeframe
Whether you trade on 1-minute charts or daily candles, this tool adapts to your chosen timeframe and uses only data from that chart. So it always reflects the way you see the market—not some generic guess.
Key Features – Because Simplicity Matters
- Set Your Own History Window
Choose how far back you want to look—keep it fresh, focused, and relevant. - No Surprises, No Repainting
Zones only appear once a bar closes. What you see is locked in. No funny business. - Auto Cleanup
Old zones fade out automatically so your chart stays clean and clutter-free. - Fast and Light
Doesn’t bog down your platform. Efficient, even during fast-moving markets. - Custom Alerts
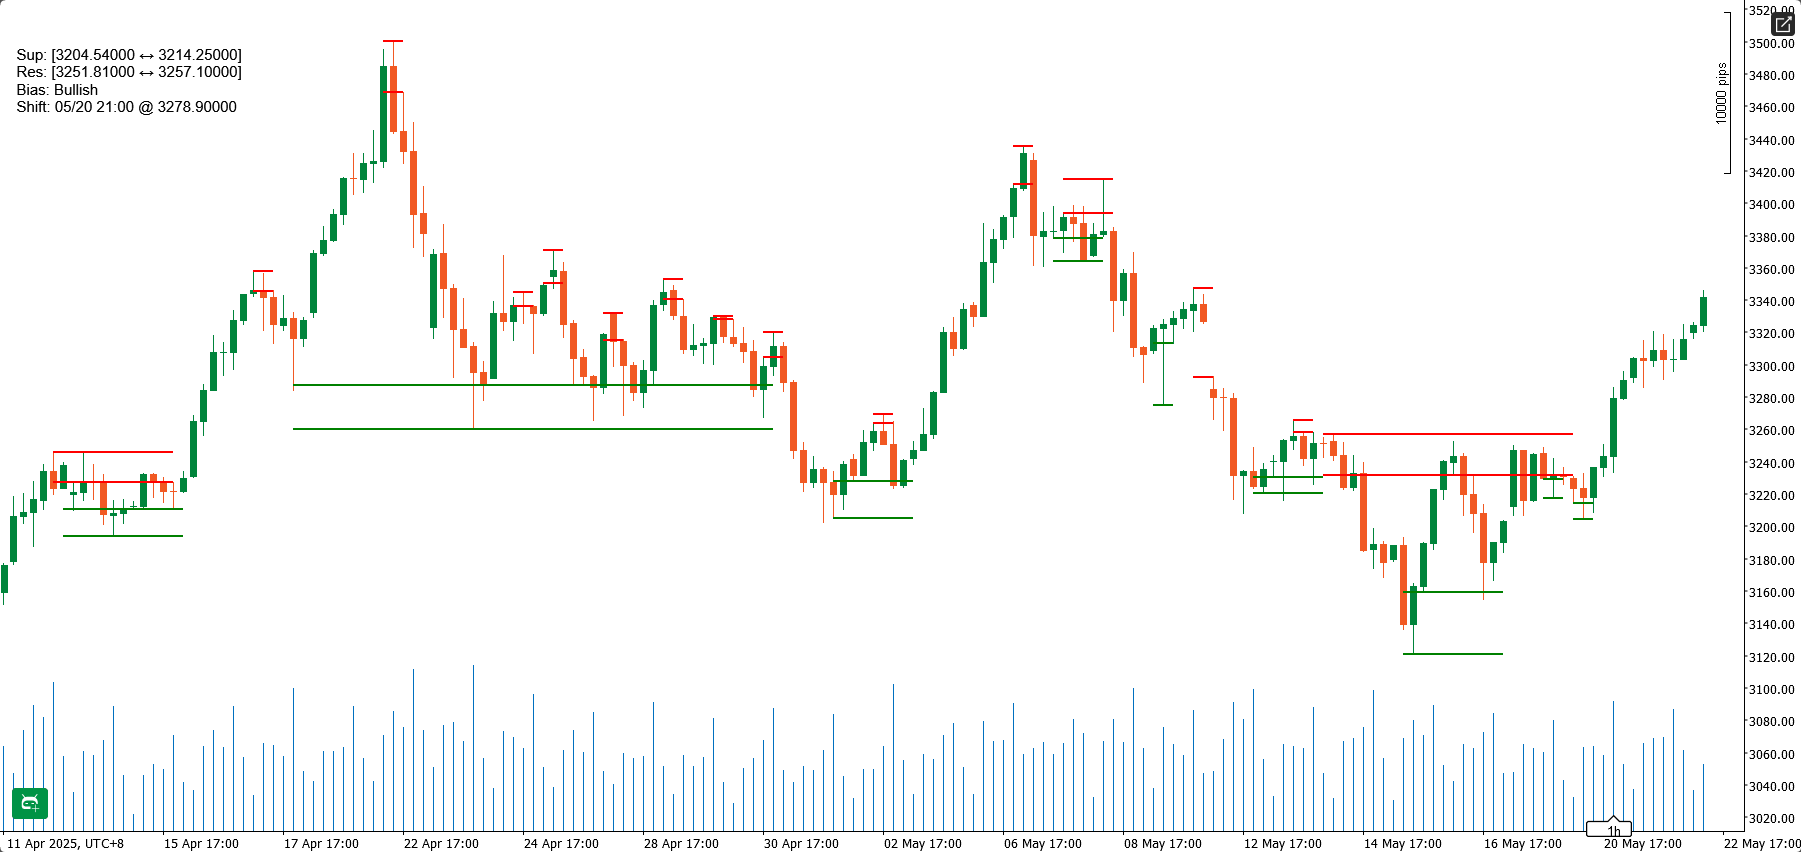
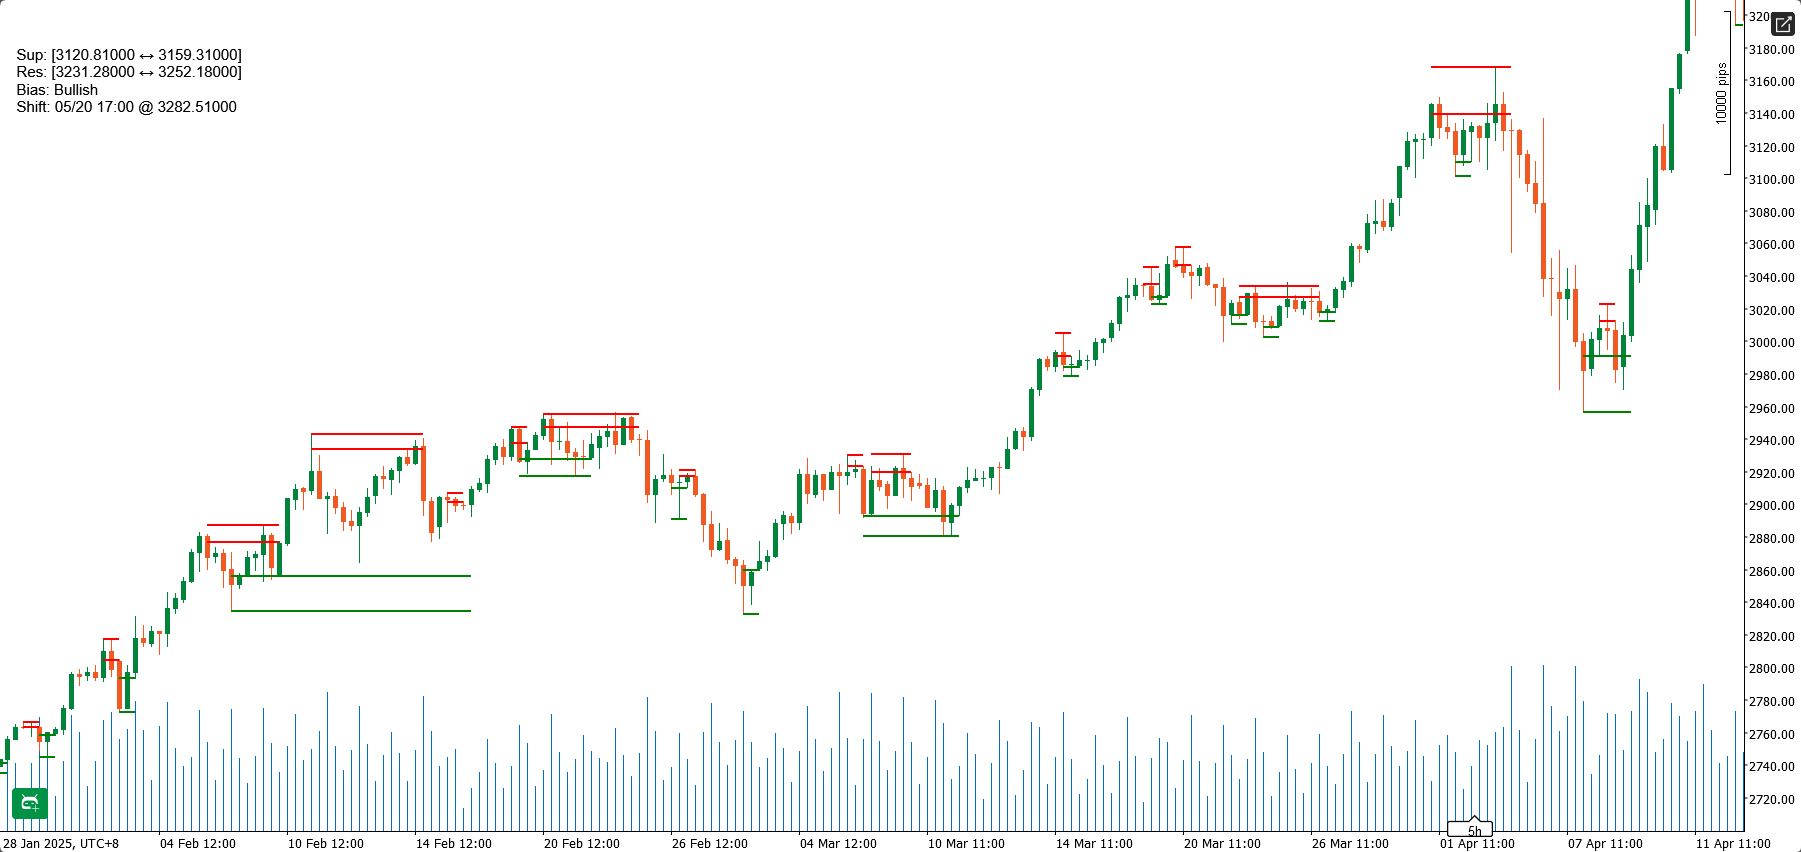
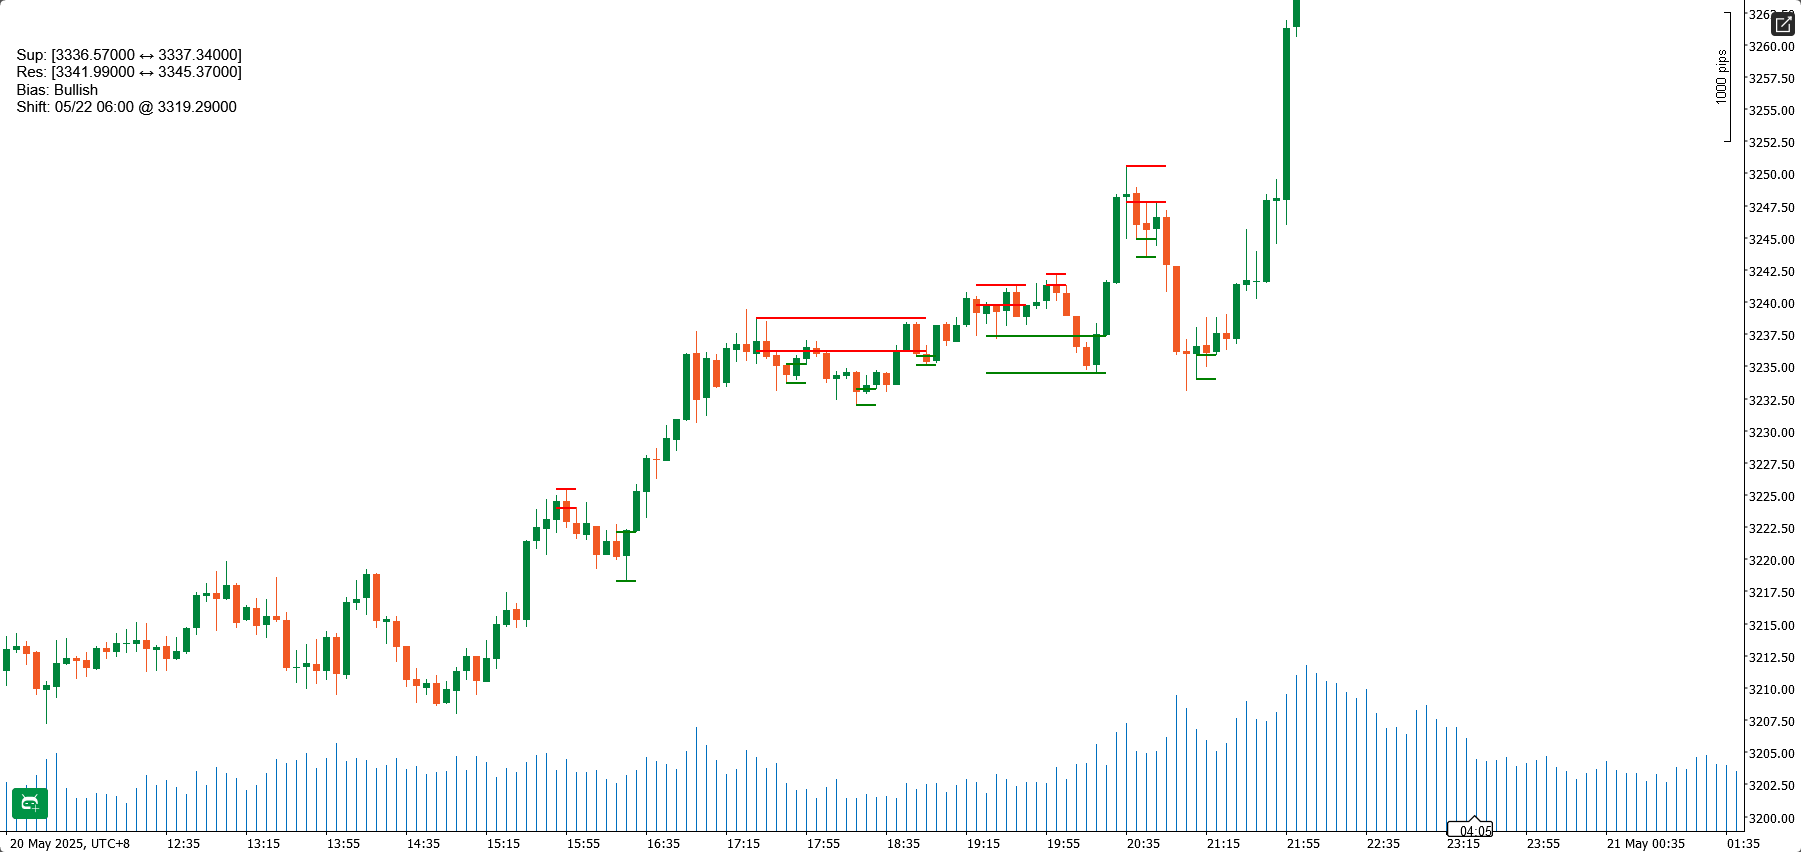
Get alerts by sound for bias change. - Built-in Dashboard
A small panel shows the current bias, support/resistance levels, and last zone break. Everything at a glance. - Universal Compatibility
Works on forex, crypto, stocks, futures—anywhere price makes swings. - Easy to Customize
Tweak the lookback period and alert rules to match your personality and trading flow. - Automation-Ready
Every shift and pivot is timestamped and sequenced, making it perfect for automation or journaling.
Why It Works (In Plain Speak)
- No Noise, Just Real Swings
It waits for true momentum shifts—so you don’t get tricked by every tiny bounce. - Zones That Act Like Price Magnets
These areas aren’t just support/resistance—they’re where real money moved. That’s why price reacts to them again and again. - Breaks That Actually Mean Something
No repainting. No fake-outs. Only real structure breaks that matter.
How You Can Use It – Real Examples
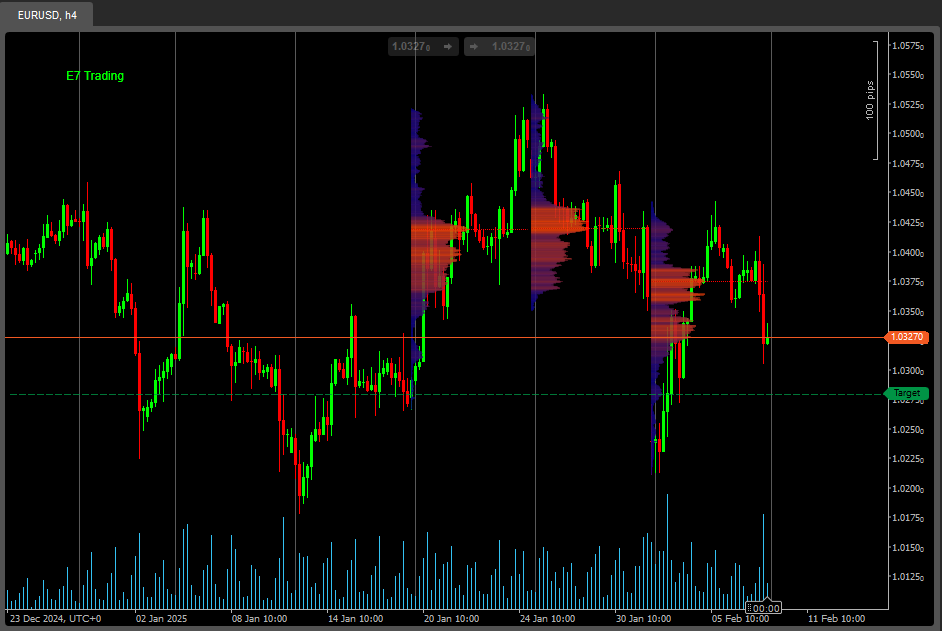
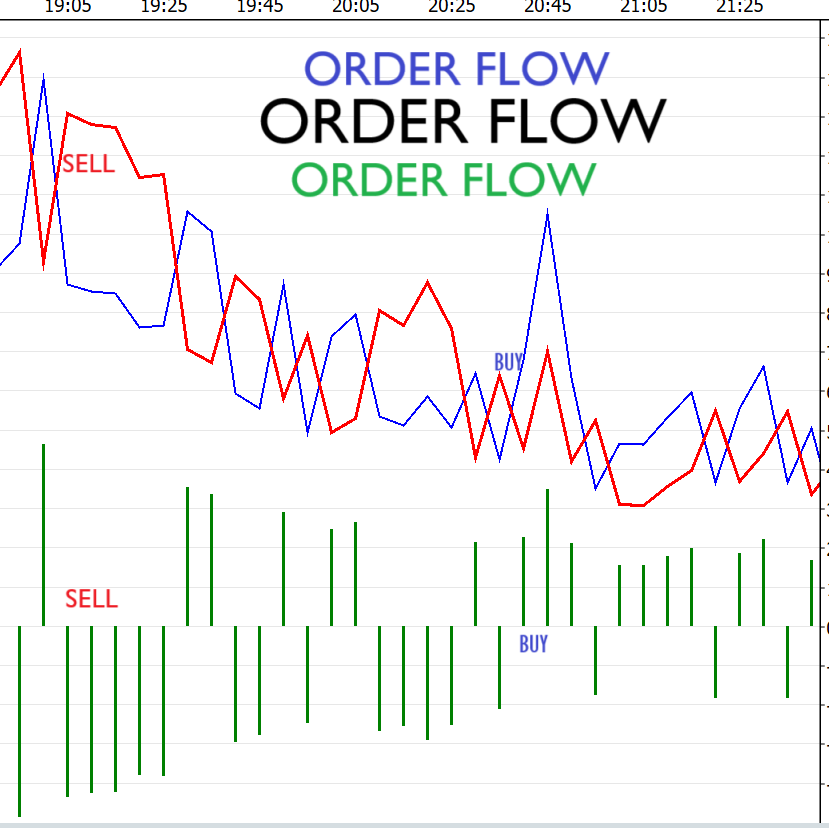
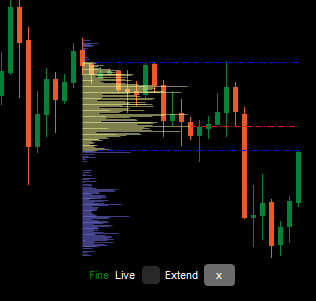
- Volume and Price Action Together
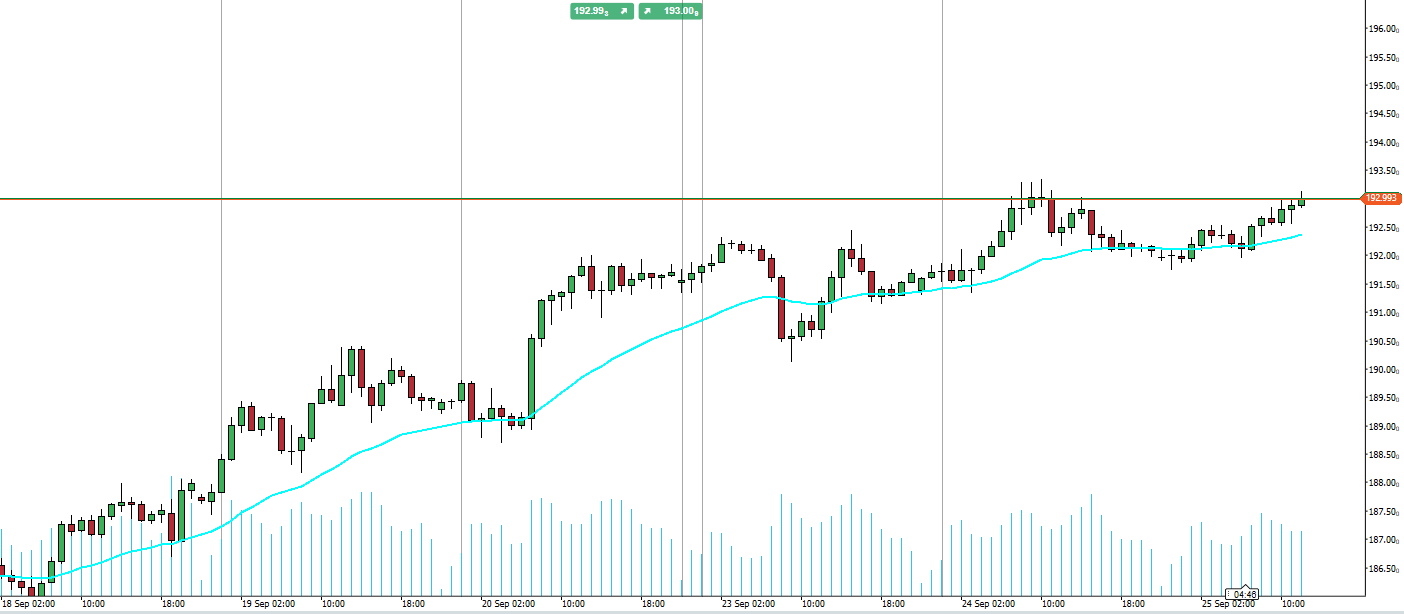
When price hits a pivot zone and volume spikes—someone big is acting. If price pulls back and shows momentum again, you’ve got your setup. - EMA Band Retests (M15/H1)
Add 20 and 50 EMA. In a trend, wait for a pullback into the zone plus EMA band. When momentum resumes—take the trade. - Order Blocks and Gaps
If your own zones line up with the indicator’s zones, that’s strong confluence. Wait for the shift and take the trade. - Liquidity Sweeps
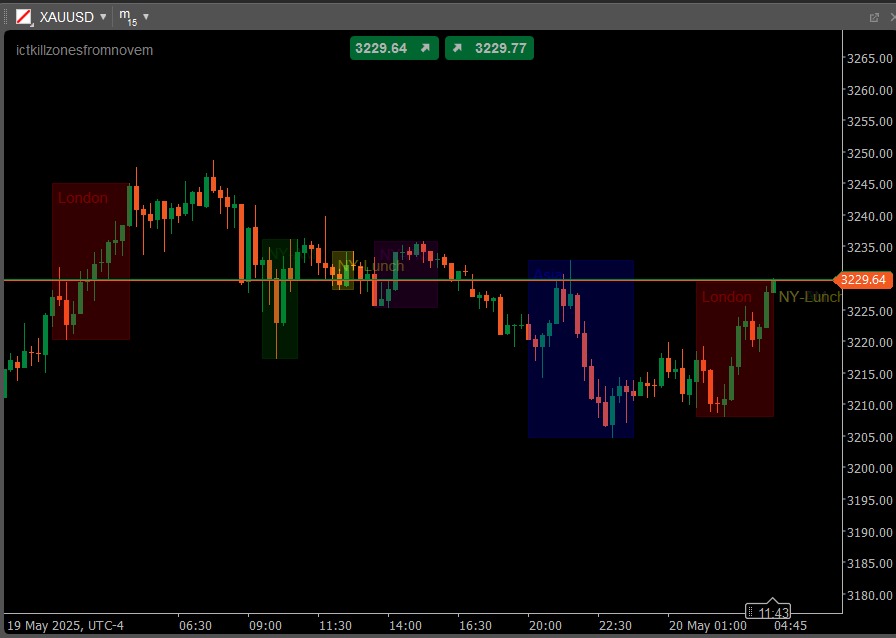
A sudden wick beyond a zone that reverses? That’s often a liquidity hunt. Wait for price to pull back with momentum before entering. - Multi-Timeframe Confirmation
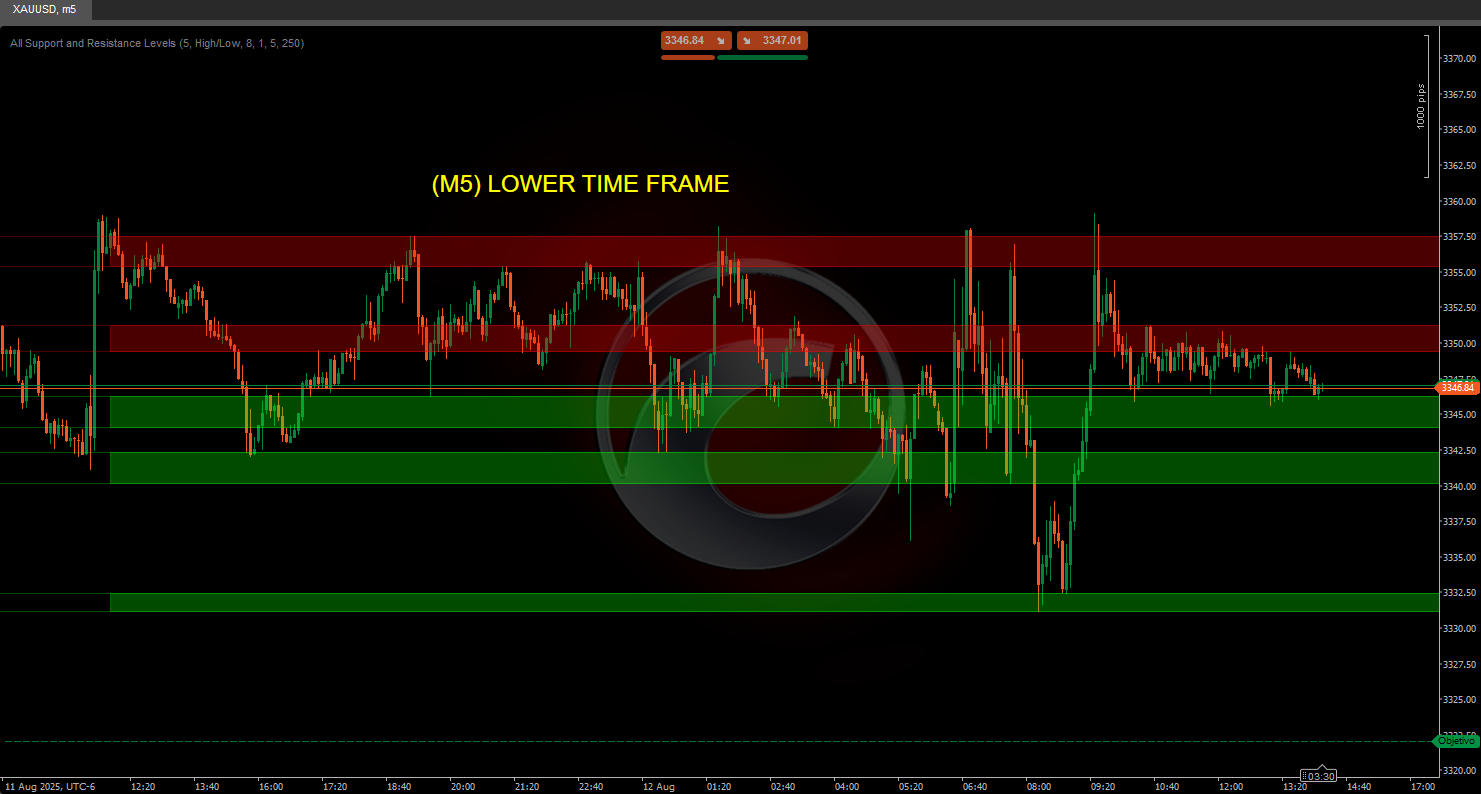
Use H4 or Daily to mark major levels. Then zoom in to M5 or M15 to catch the exact entry when price shows it’s ready.
Putting It All Together
- Pick your chart timeframe—scalping, day trading, swing. Your choice.
- Let the indicator find and merge the important pivot zones.
- Layer on your favorite tools—EMAs, volume, order blocks.
- Wait for the market to tip its hand—momentum shift inside a key zone.
- Use the alert system to stay ready and aligned.
PERSONAL STRAT
I personally use this to find possible POI to trade from. I only pick where major volumes is, and i wait for price to touch it. My bias is determined from H6 timeframe. Then i go M15 timeframe and look for places of confluence. Might be previous session rally + volumes, Volume spikes with institution candles, many pivots area formations, many pivots merging areas (more orders) and etc. More the better and wait for retracement to that area and take a trade. You can even use Bos + retest with some bias confluence or session timing confluence if your scalping. It works well.
Important Note
This isn’t a crystal ball. It’s a tool—a powerful one—but still just a tool. Trading involves risk. Use your head, your rules, your strategy. Don’t risk what you can’t afford to lose. And when in doubt, get professional advice.
.jpg)