!["[Hamster-Coder] Price" logo](https://market-prod-23f4d22-e289.s3.amazonaws.com/b9c21584-bde2-4113-83c1-d6e5d82a9ca1_Icon300.jpg)
!["[Hamster-Coder] Price" uploaded image](https://market-prod-23f4d22-e289.s3.amazonaws.com/29cb622f-b3f9-48f1-b9e1-b87c467c754a_chart-view.png)
!["[Hamster-Coder] Price" uploaded image](https://market-prod-23f4d22-e289.s3.amazonaws.com/31b8f2d6-9336-4843-9f52-e96b921fd33b_settings.png)
Current Version
Version: 1.3.0
Version Date: 2025-08-02 15:00:00
(Ensure the displayed version on the chart matches this value — see version check below.)
Description
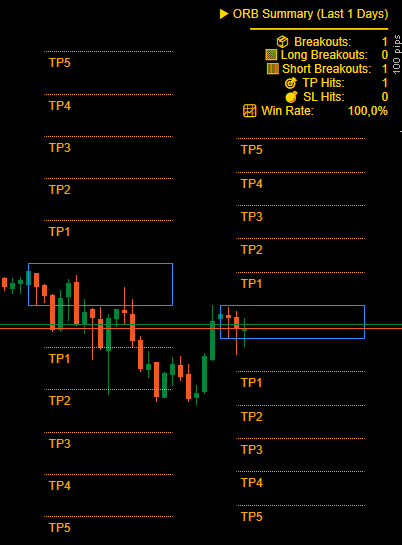
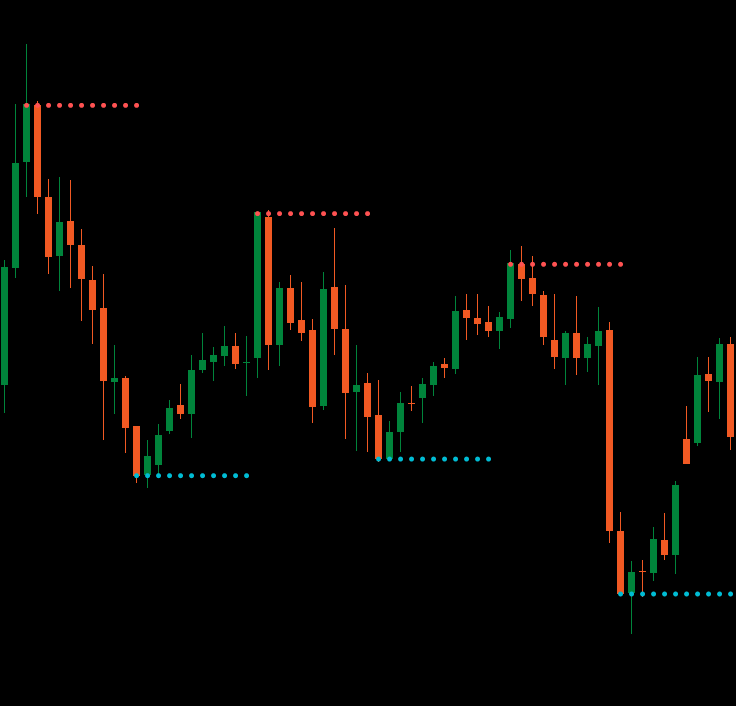
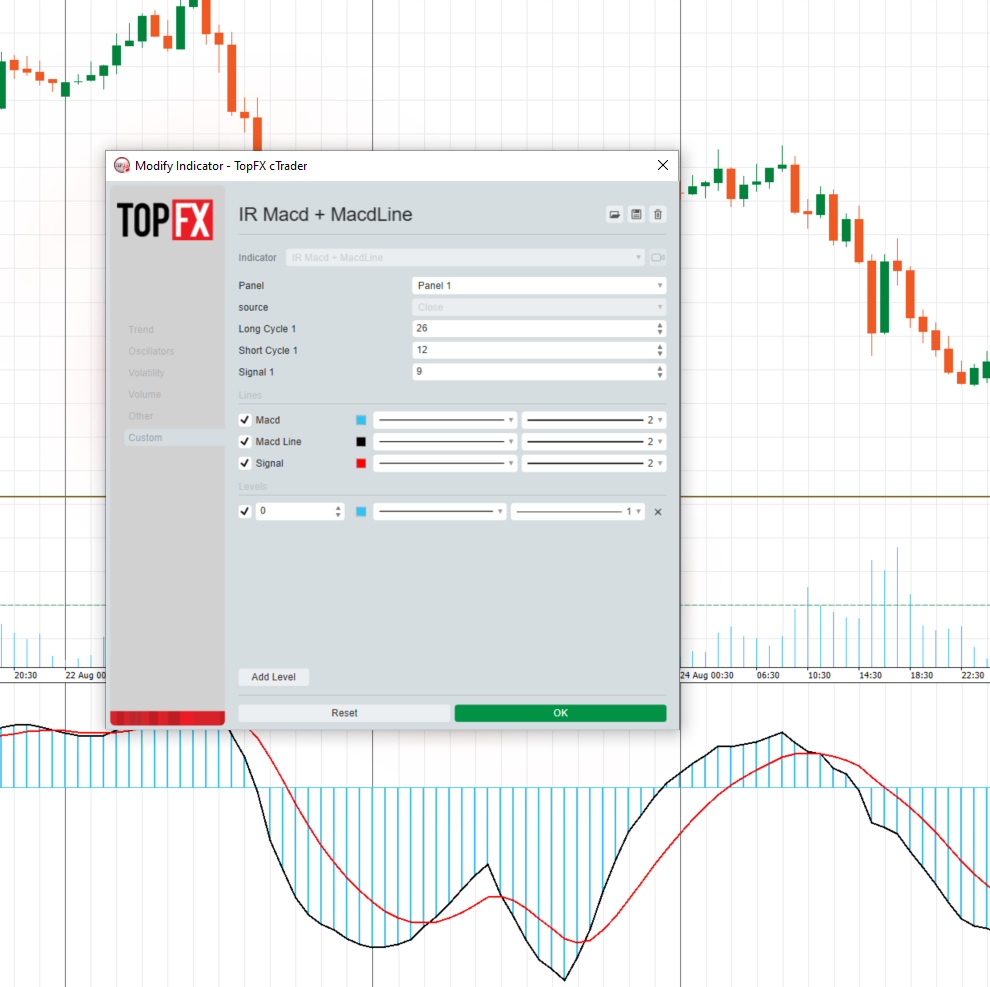
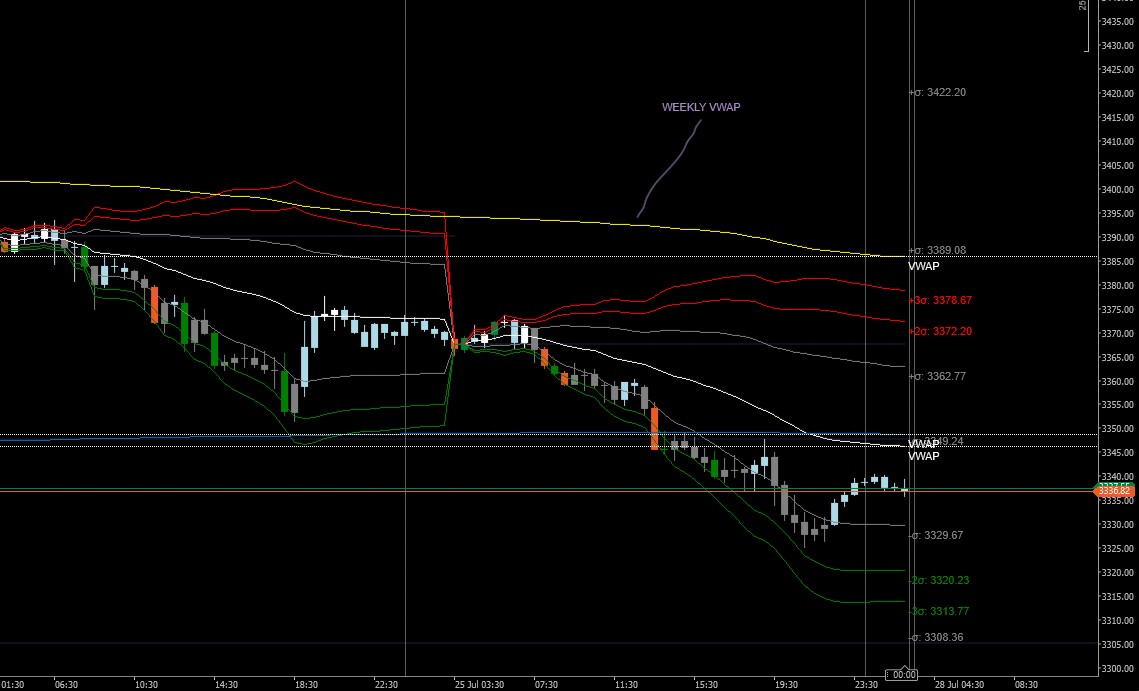
The [Hamster-Coder] Price Indicator is a core component of the Hamster-Coder™ Algo Series, designed to calculate and manipulate price inputs (sources) in real time. Unlike standard source selection in cTrader, this indicator enables full multi-timeframe price input control — both during and after deployment.
Hamster-Coder™ Algo Series
This indicator is part of a powerful toolkit implementing Timeframe Decoupling — a proprietary concept allowing you to assign separate timeframes to each key parameter. The result: true multi-timeframe analysis on a single chart — a game-changing capability for modern traders.
📌 To explore more indicators from this series, search for “Hamster-Coder” in the cTrader platform.
Key Features
- 🧠 Timeframe Decoupling (series feature)
Assign independent timeframes to components like the basis (e.g., moving average) and deviation source for precision control. - 🕒 Multi-Timeframe Price Inputs
Choose fromOpen,Close,High,Low,HL2,HLC3,HLCC4, orOHLC4— from any available timeframe. - ⚡ Real-Time Adjustments
Change parameters after the indicator is applied — something not possible with defaultsourceproperties in cTrader. - 🎯 Offset Functionality
Apply custom time offsets (default =1) to shift the selected timeframe backward. - 🔌 Seamless Integration
Designed to work perfectly with both manual trading and automated strategies.
How to Use
- Select Timeframe – e.g.,
1H - Select Source – e.g.,
High - Set Offset – e.g.,
1 - Apply to Chart – e.g., on a
1Mchart
➡️ You will now see the line corresponding to the prior 1H bar’s High.
Version Check
Set Show Version = Yes to display the current version in the bottom-right corner of the chart.
✅ Make sure this version matches the "Current Version" listed at the top of this description.
❗ If there's a mismatch — contact support or reach out to me directly.
P.S.
Happy trading!
Feel free to leave comments with suggestions, feature requests, or inquiries about custom development.
!["[Hamster-Coder] Moving Average" logo](https://market-prod-23f4d22-e289.s3.amazonaws.com/fd853887-8360-4212-b037-22b554a23dc6_hamster-coder-2.jpg)
!["[Hamster-Coder] Pivot Points MTF" logo](https://market-prod-23f4d22-e289.s3.amazonaws.com/08b4bf19-ebf2-422e-9a8a-b4a97bc636ca_Icon300.jpg)
!["[Hamster-Coder] Pivot Points (Demo)" logo](https://market-prod-23f4d22-e289.s3.amazonaws.com/6a1481e2-bd00-4037-bcf0-33495594f95a_Icon300.jpg)
!["[Hamster-Coder] Bollinger Bands" logo](https://market-prod-23f4d22-e289.s3.amazonaws.com/1114cb2b-7120-42b3-8f53-dbc26968e6af_Icon300.jpg)
!["[Hamster-Coder] Pivot Points" logo](https://market-prod-23f4d22-e289.s3.amazonaws.com/3c48c5d9-506b-4c95-a900-819a312f8649_Icon300.jpg)
!["[Hamster-Coder] Moving Average MTF" logo](https://market-prod-23f4d22-e289.s3.amazonaws.com/9aea8393-48a3-4e7d-bb1f-45905f6cf344_Icon300.jpg)


!["[Stellar Strategies] Linear Regression Candles 1.1" logo](https://market-prod-23f4d22-e289.s3.amazonaws.com/19ef277f-e0b6-48ef-8941-88bfbba145f3_cT_cs_4141285_EURUSD_2025-03-30_19-53-31.png)

.jpg)