KANDIKA HEAT MAP

20/07/2025
Desktop
Since 08/06/2025
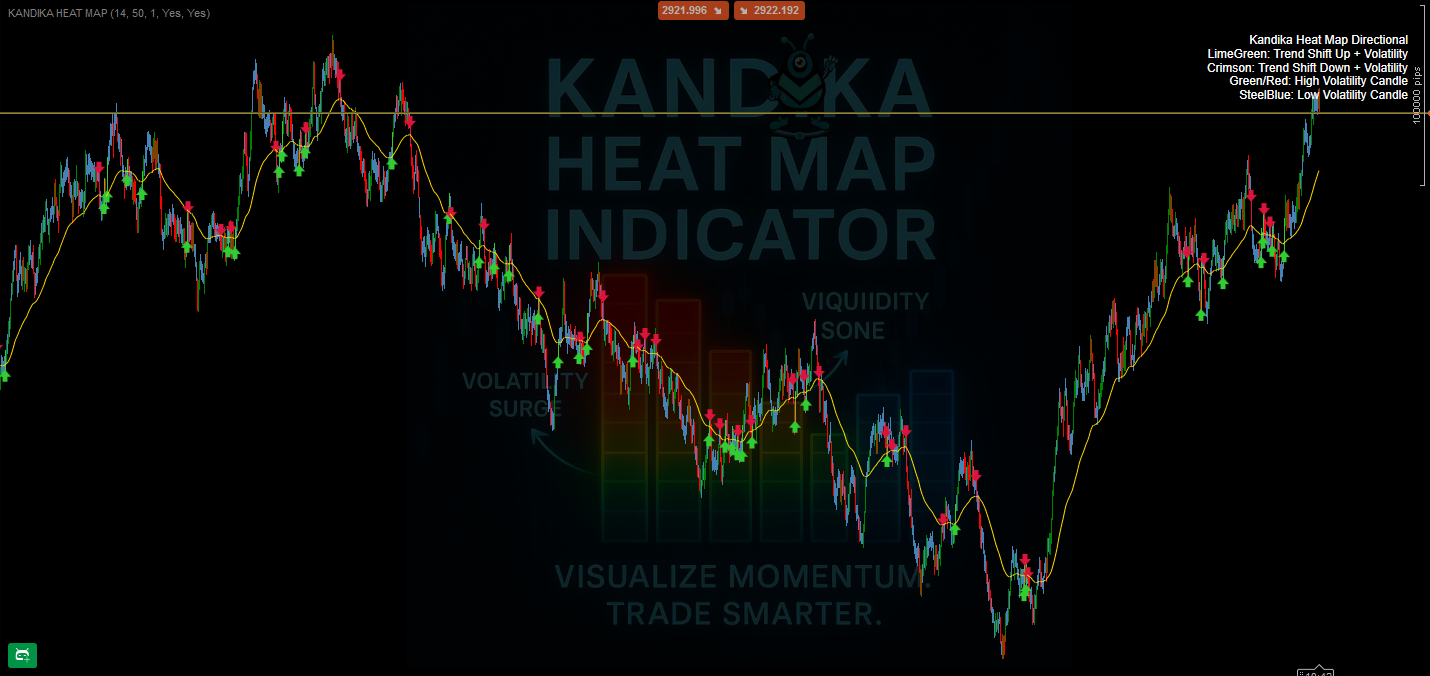
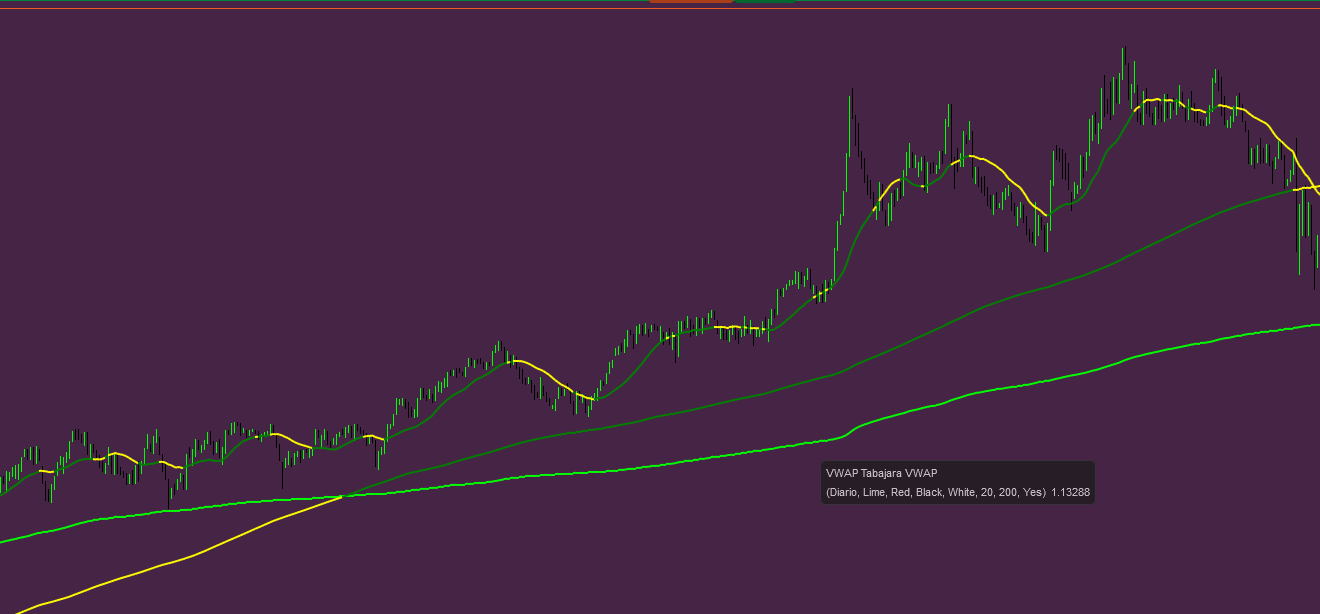
🎨 Color Logic – What It Tells You
- 🟩 Lime Green → Trend Shift Up
A bullish momentum change is forming. Use it to catch early upside. - 🟥 Crimson → Trend Shift Down
Signals downside pressure building. Prepares you for potential shorts or exits. - 🟧/🔴 Orange/Red → High Volatility Zone
Expect price spikes, fast moves, and potential traps. Not a place to guess blindly—confirm your strategy. - 🟦 Steel Blue → Low Volatility Zone
Market is slowing, compressing, or ranging. Often sets up for breakout opportunities.
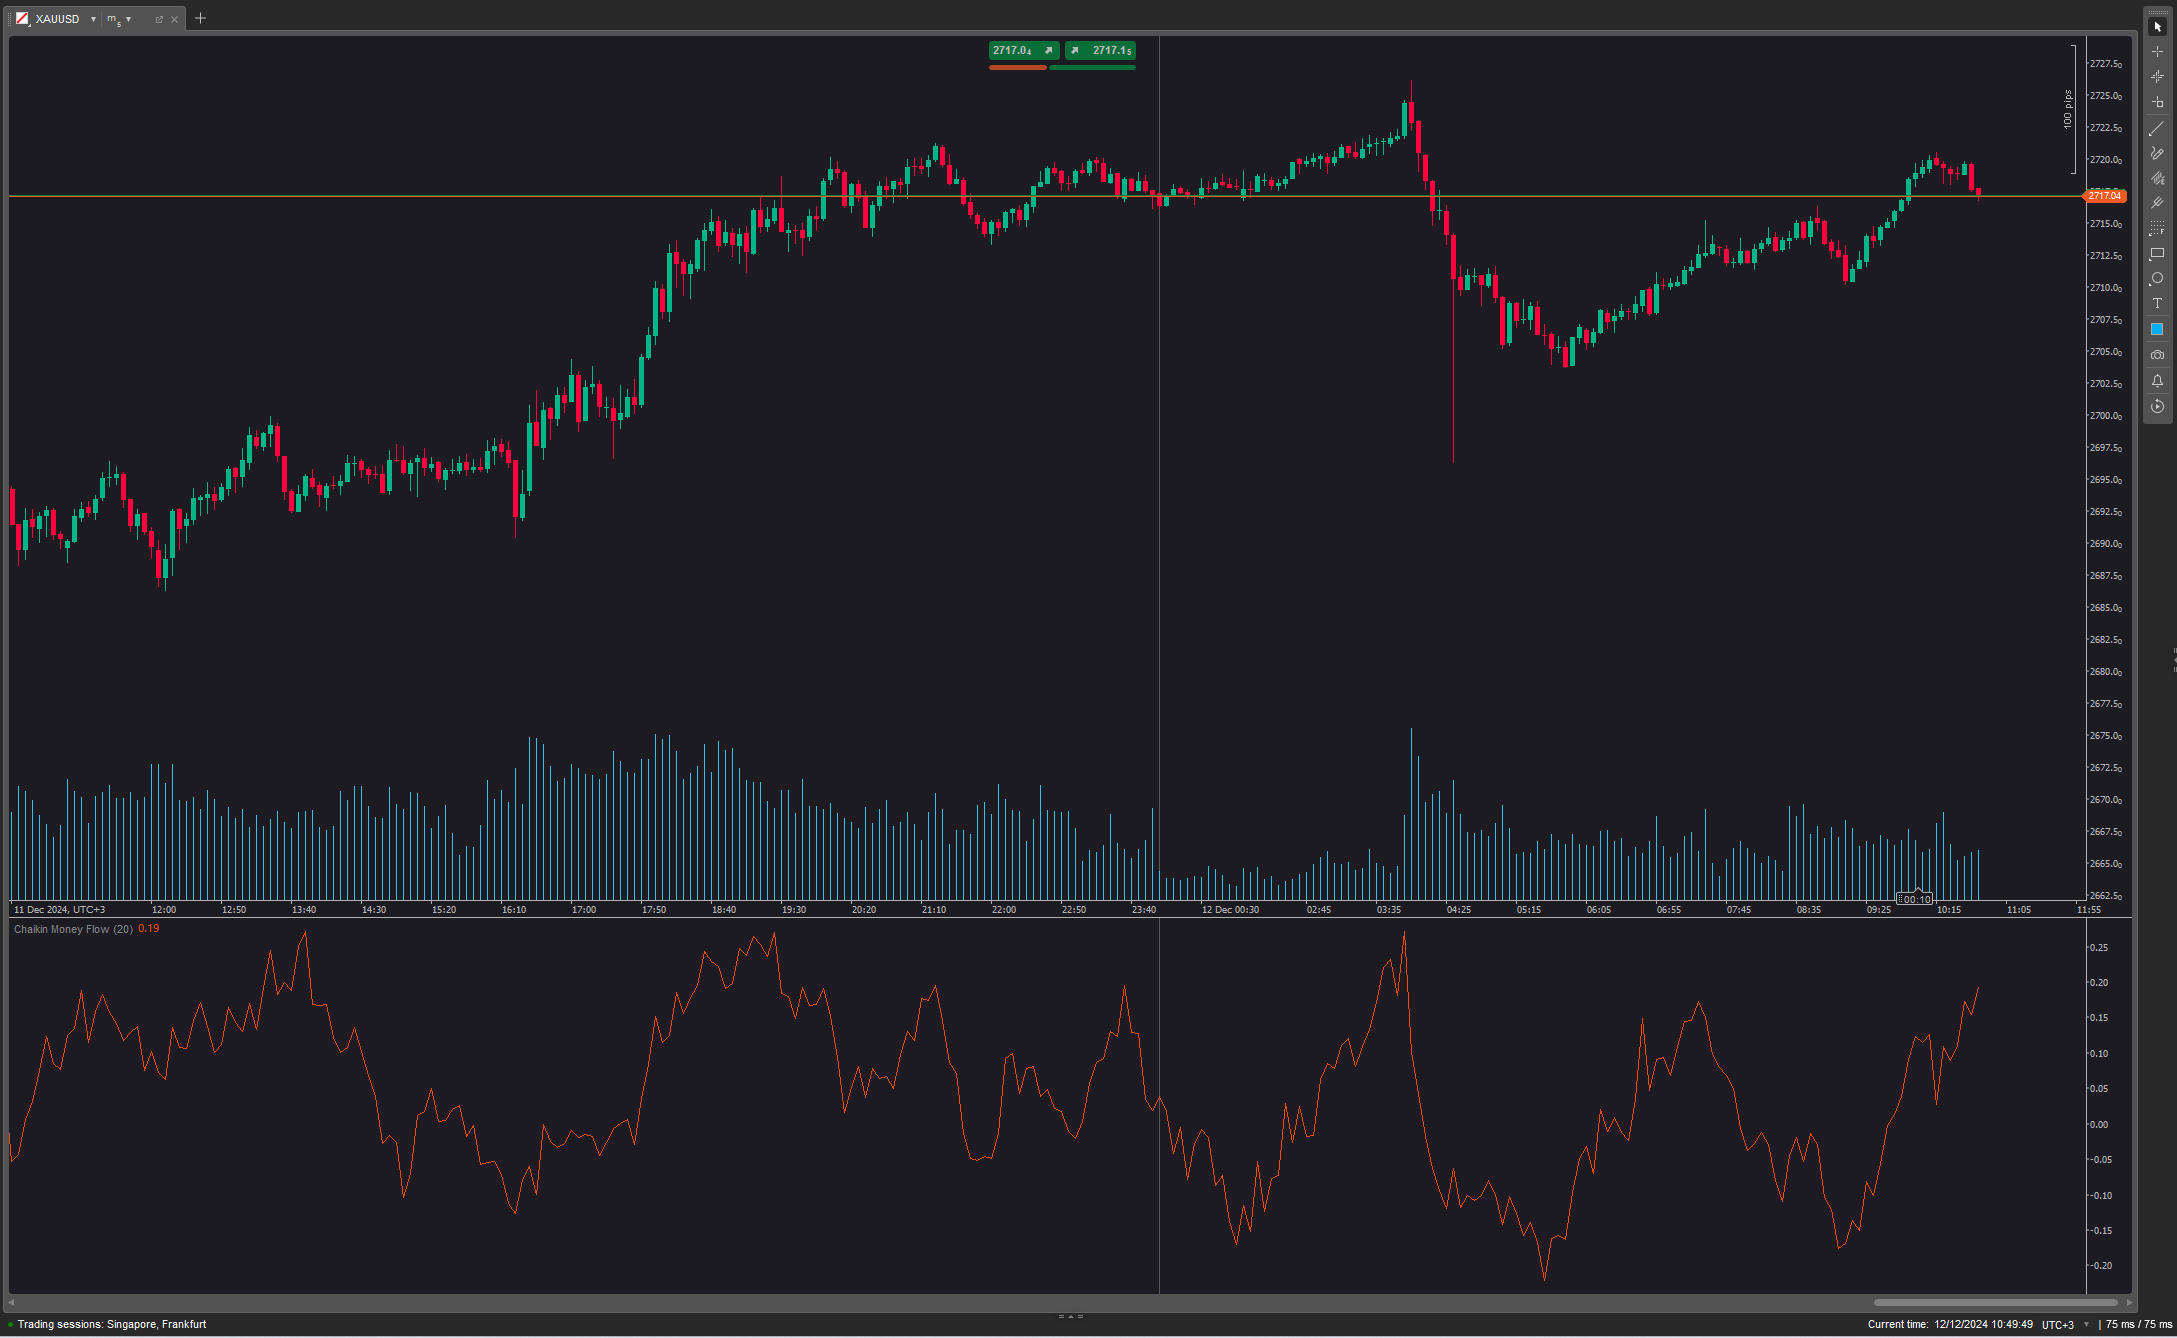
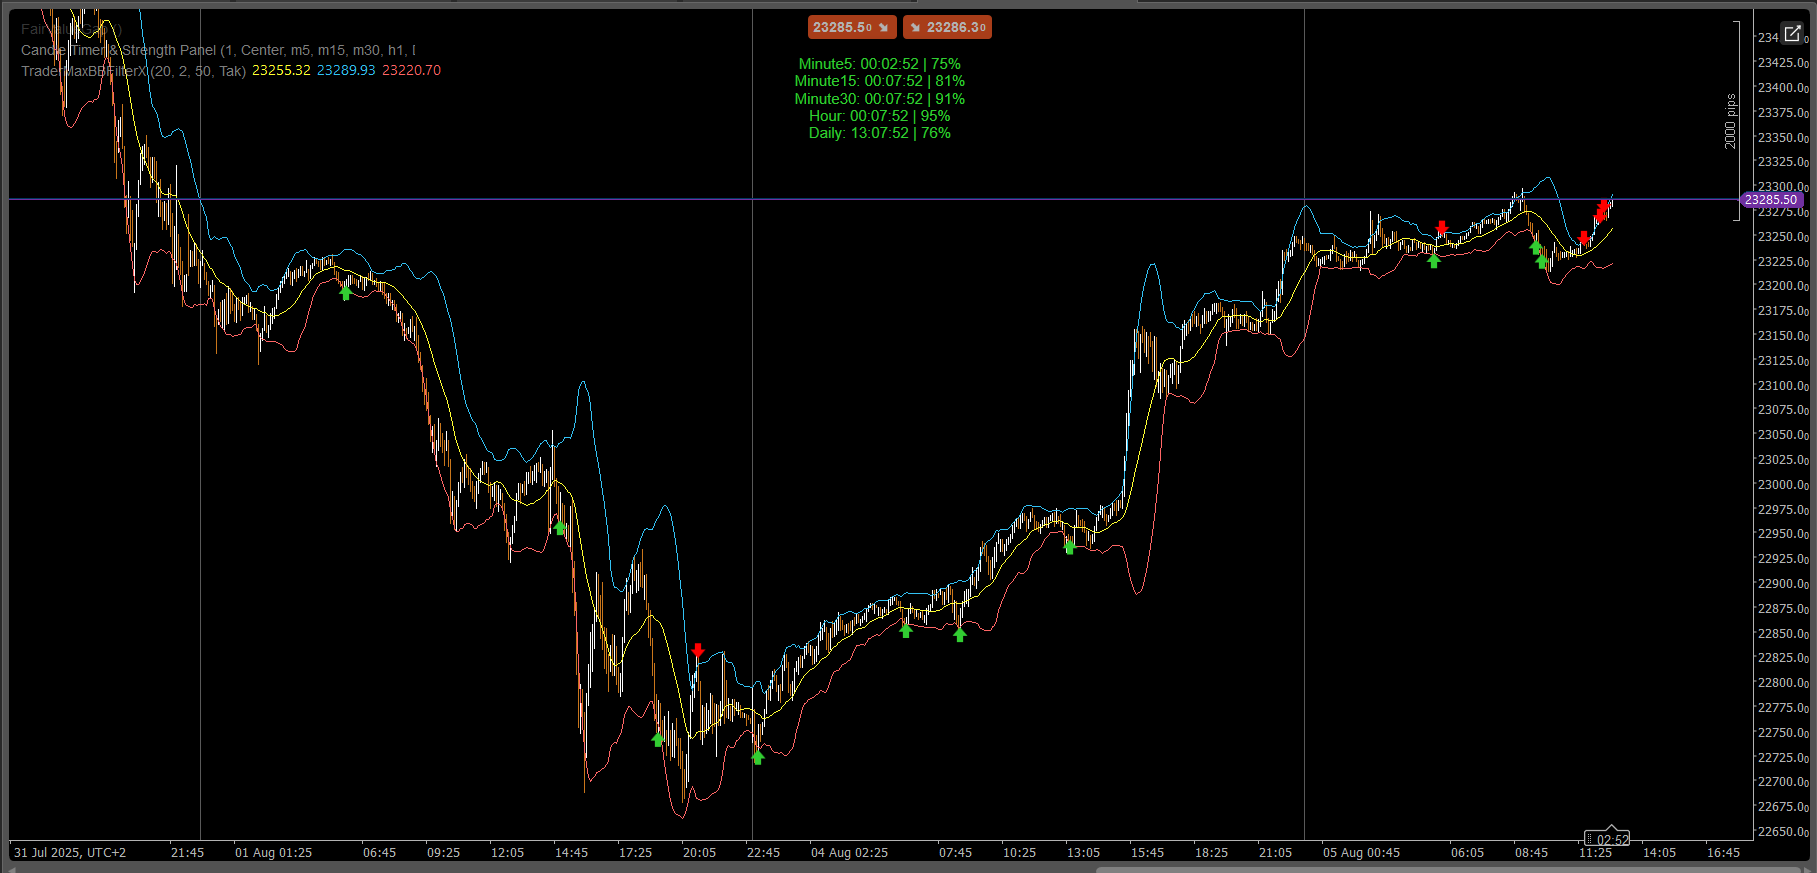
📊 What It Does (And Doesn’t Do)
- ✅ Clearly maps out trend direction changes
- ✅ Visually separates calm vs. volatile zones
- ✅ Simple, chart-friendly overlay—no clutter
You may also like


.jpg)