# 🚀 Professional VPFR (Volume Profile Fixed Range) Indicator - Only $10!
## Transform Your Trading with Advanced Volume Analysis
*Unlock the secrets of institutional trading* with this powerful Volume Profile Fixed Range indicator, designed specifically for cTrader platform. Now available at an incredible price of just *$10* - a fraction of what similar professional tools cost elsewhere!
## 🎯 Key Features That Set You Apart
### 📊 *Advanced Volume Distribution Analysis*
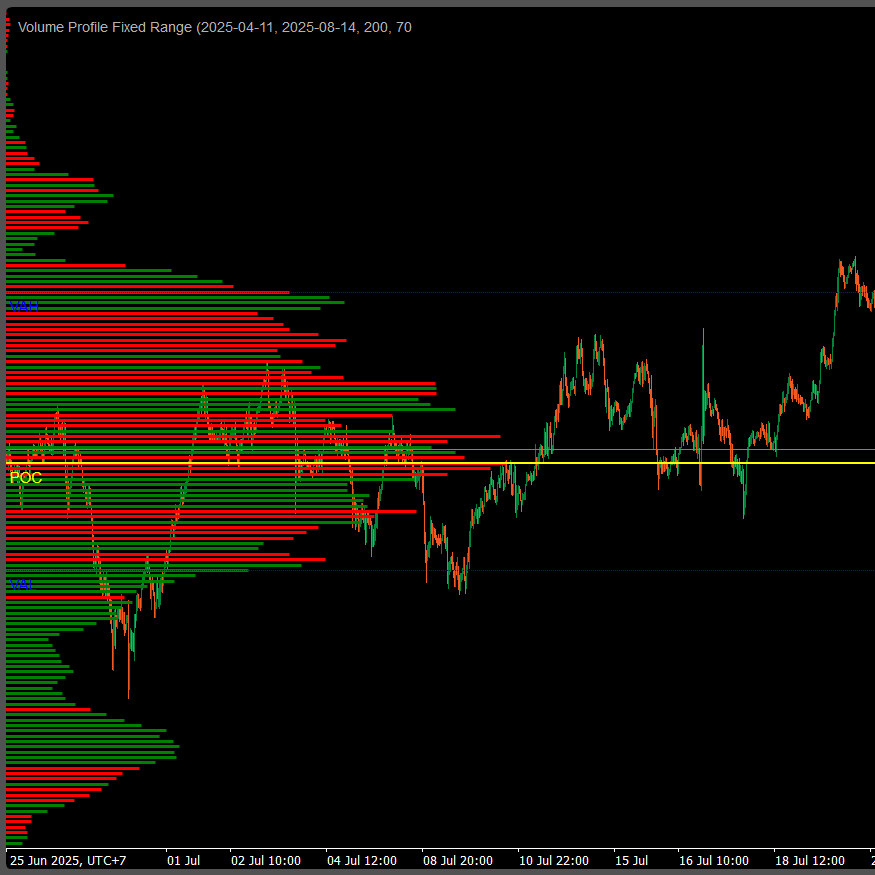
- *Fixed Range Volume Profile*: Analyze volume distribution over any custom date range
- *Smart Price Level Distribution*: Automatically distributes volume across multiple price levels within each bar
- *Professional Volume Calculation*: Uses sophisticated algorithms to map volume density accurately
### 💎 *Critical Trading Levels*
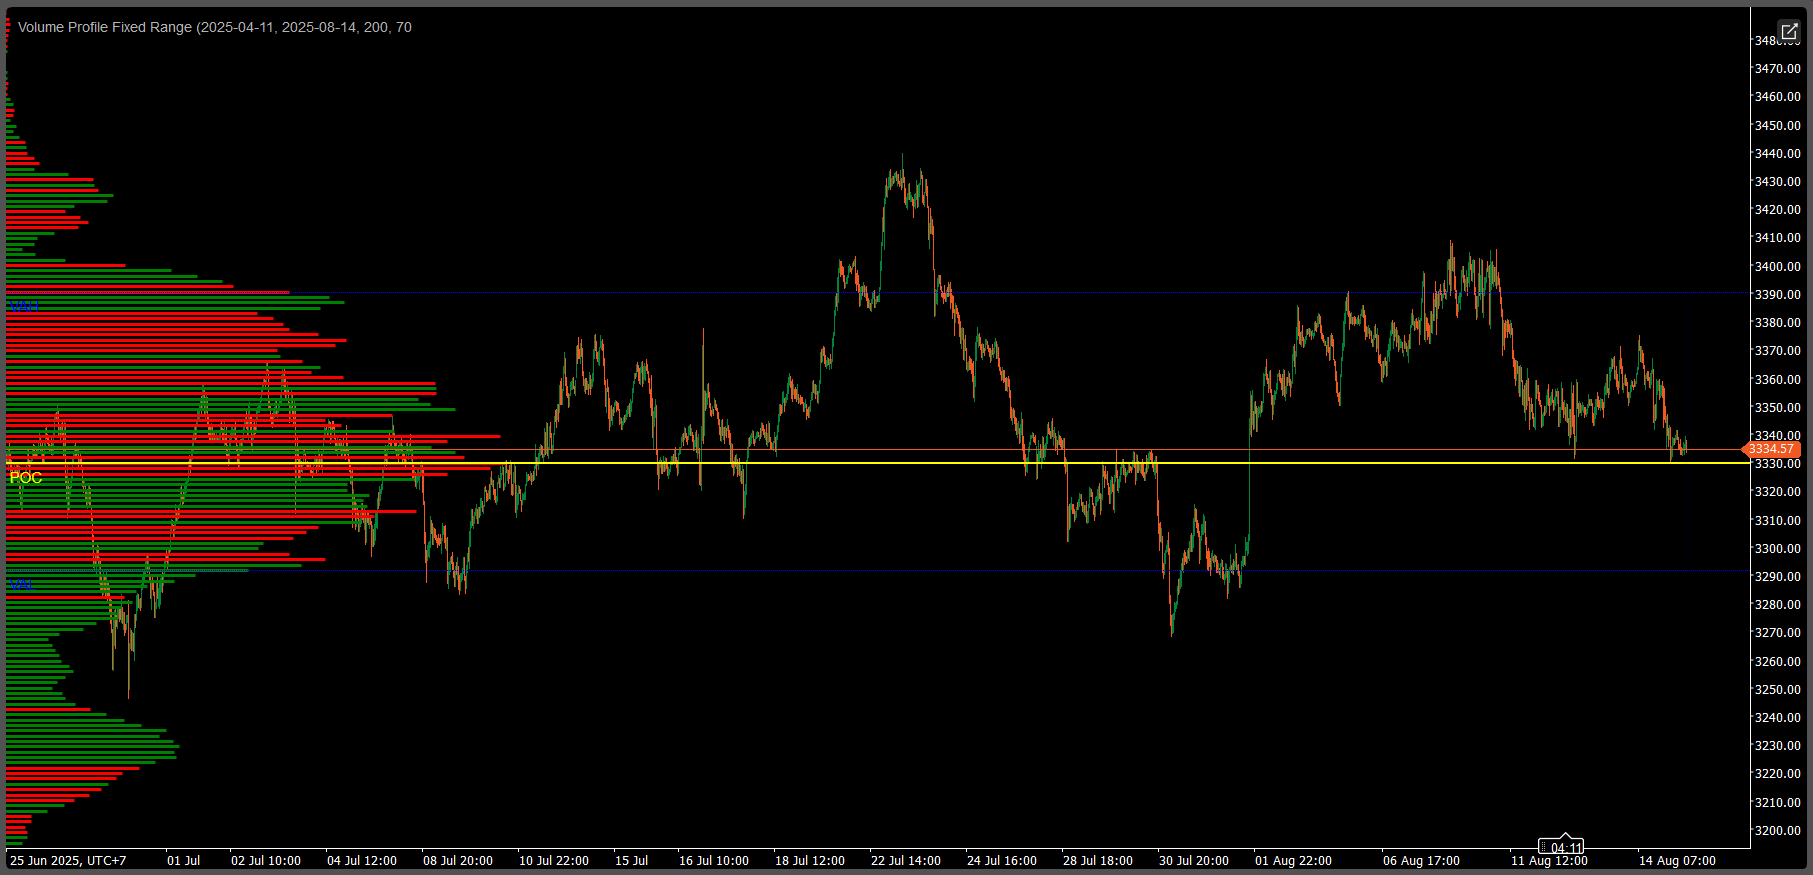
- *POC (Point of Control)*: Instantly identify the price level with highest volume activity
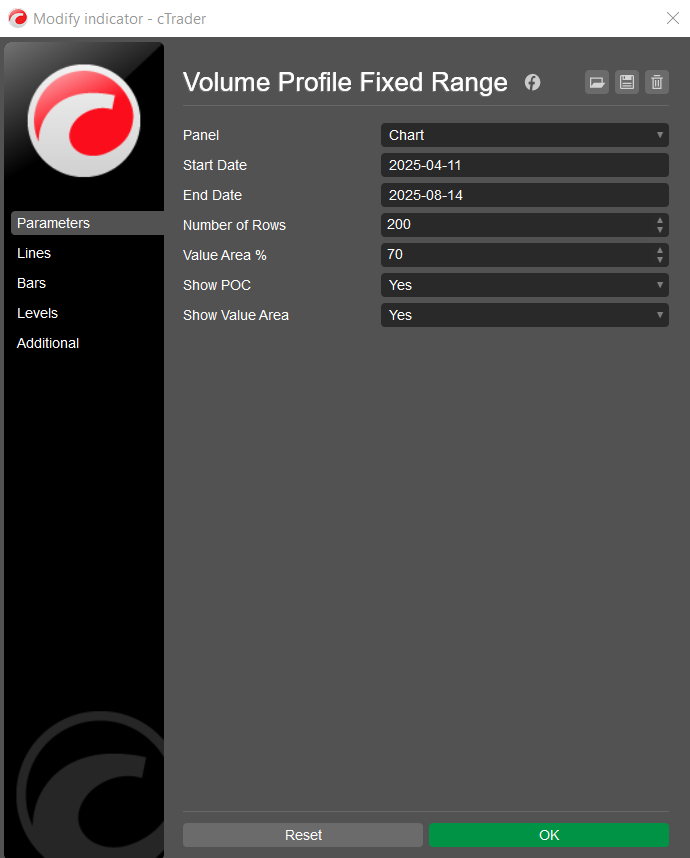
- *Value Area High (VAH) & Low (VAL)*: Automatically calculate the range where 70% of volume occurred
- *Customizable Value Area*: Adjust from 50% to 95% based on your trading strategy
### 🎨 *Visual Excellence*
- *Color-Coded Volume Bars*: Green for bullish volume, red for bearish volume
- *Buy/Sell Pressure Analysis*: Distinguish between buying and selling pressure at each level
- *Clean Professional Display*: Horizontal volume bars that don't clutter your chart
- *Smart Positioning*: Automatically positions elements for optimal visibility
### ⚙ *Full Customization Control*
- *Flexible Date Range*: Set any start and end date for your analysis
- *Adjustable Resolution*: Choose from 10 to 200 price rows for perfect granularity
- *Toggle Features*: Show/hide POC and Value Area lines as needed
- *Real-time Updates*: Automatically recalculates when you reach the last bar
## 💰 Why This $10 Investment Will Transform Your Trading
### 🎯 *Institutional-Level Insights*
Most retail traders rely on basic price action, but *smart money* trades based on volume. This indicator gives you the same volume analysis tools used by professional traders and institutions.
### 📈 *Multiple Trading Strategies*
- *Support/Resistance Trading*: POC often acts as strong support/resistance
- *Breakout Trading*: Volume profile edges signal potential breakout points
- *Mean Reversion*: Price tends to return to high-volume areas (POC)
- *Range Trading*: Value Area provides clear range boundaries
### ⚡ *Competitive Advantage*
- Similar indicators cost $50-200+ on other platforms
- No monthly subscriptions or hidden fees
- One-time purchase, lifetime use
- Works perfectly with cTrader's advanced charting
## 🔧 *Easy Setup & User-Friendly*
- *Plug & Play*: Simply install and start trading immediately
- *Intuitive Parameters*: Clear, easy-to-understand settings
- *No Complex Configuration*: Works great with default settings
- *Lightweight Code*: Won't slow down your platform
## 🎁 *What You Get for Just $10*
✅ Complete VPFR indicator source code
✅ Professional volume profile analysis
✅ POC identification system
✅ Value Area calculation engine
✅ Buy/sell pressure visualization
## 🚨 *Limited Time Offer - Regular Price $29*
Don't let this opportunity slip away! Professional volume analysis tools typically cost hundreds of dollars. Get institutional-level insights for the price of a coffee.
## 💯 *Perfect For:*
- Day traders seeking volume confirmation
- Swing traders identifying key levels
- Scalpers finding optimal entry/exit points
- Professional traders wanting volume edge
- Anyone serious about understanding market structure
*Transform your trading today with professional volume analysis. Your future profitable self will thank you!*
---
Compatible with cTrader platform | Instant download after purchase | 30-day money-back guarantee
!["[Stellar Strategies] QQE" logo](https://market-prod-23f4d22-e289.s3.amazonaws.com/ed4b3af5-54e4-404e-80eb-a23fa7ef0282_cTrader_7oDDAbSmSP.png)