Automatic Fibonatti - Renko
"Automatic Fibonatti - Renko" logo
15/09/2025
Desktop
Since 05/02/2025
Sales
11
"Automatic Fibonatti - Renko" uploaded image"Automatic Fibonatti - Renko" uploaded image

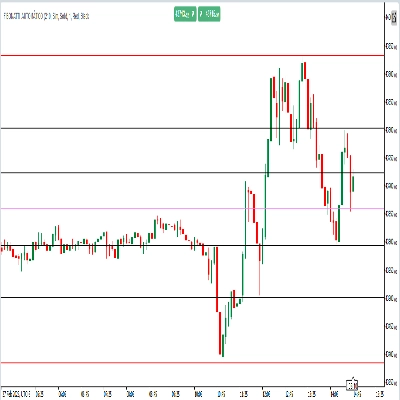
Auto Fibonacci RENKO for cTrader


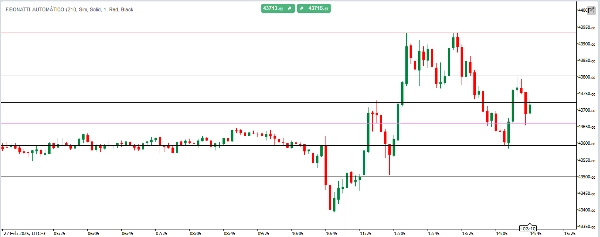
Automatically identify key price levels — fully customizable to your strategy.
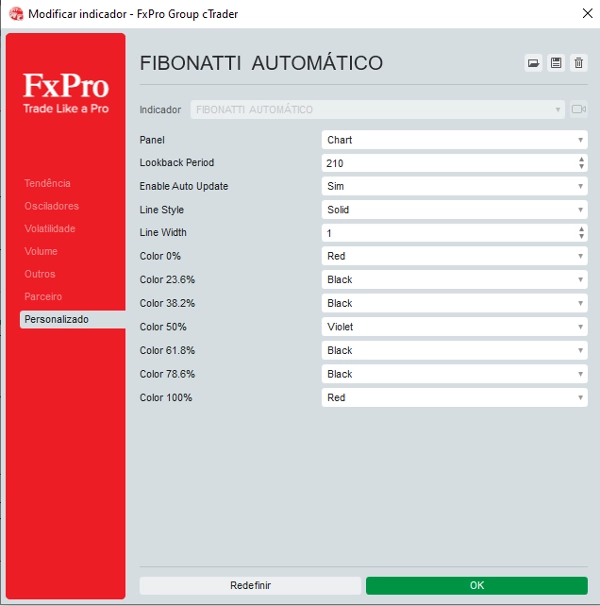
Auto Fibonacci is a smart and flexible indicator that automatically draws Fibonacci retracement levels based on the highest and lowest prices over a user-defined period. What sets it apart is its full customization: personalize each Fibonacci level’s color, line style, and thickness to suit your visual preferences and trading strategy. It also features real-time updates, so your chart always reflects the latest price action — no manual adjustments needed.

0.0
Reviews: 0
Customer reviews
No reviews for this product yet. Already tried it? Be the first to tell others!
More from this author
Renko Reversal
Renko Reversal catches powerful wick rejections on cTrader.
VolumeColorBar
Color Volume Bars – Visualize Market Strength Instantly
Automatic Fibonatti
Automatically plots Fibonacci retracement levels using the highest and lowest points of a customizable time range
Indicator
Breakout
VIX - volatility indicator
Ride the Volatility – Smart VIX Tool
Indicator
Breakout
VIX - volatility indicator - Renko
Volatility indicator for Renko.
Indicator
Indices
RSI
RSI
RSI Pro Tool – Overbought & Oversold Made Easy
BOT REJECTION - SOLUTIONS FOR INVESTORS
Rejection Bot – Precision Trading at Key Levels
Indicator
Indices
Prop
Commodities
+3
ADX Indicator_noSourceCode
Identify Trend Strength with Absolute Precision on cTrader
You may also like
Time Marker
CaptraTimeMarker: Marks key trading hours with lines & labels, plus daily separators for cTrader. Customizable & precise
TDI_Pro
Traders Dynamic Index (TDI) — Divergence Edition
Parabolic RSI Alert  V1
Master RSI reversals with Parabolic SAR precision! Get real-time alerts for high-probability trend changes.
Indicator
Signal
Master Dragom SR
Indicator,combines with several strategies.MA locate trends,pullback, signal volumes, reversals, support and resistance
Indicator
Indices
Prop
Stocks
+3
LT_Ind_Pivot
Draws pivots (P, S/R, CPR) from selected anchors like H1–Month1, with optional mid-levels (PS1, S1S2, etc.)
TraderMaxBBflterXDemo-
TraderMax BB Filter X (DEMO) for cTrader 🧪 Limited-Time Demo Version (24h) TraderMax BB Filter X (DEMO) is a precision
Indicator
NAS100
NZDUSD
XAUUSD
+11
Market Info bY MohammadKHR
Daily High & Low with live Percentage change.
Indicator
Indices
RSI
Stocks
+5
REDGREENZONEREVERSAL
The Red & Green Zone Reversal Indicator detects overbought and oversold market conditions using Bollinger Bands and RSI.
E7 Correlation Dashboard
E7 Correlation Dashboard.
DMI 3 bar v2
Shows BUY & SELL signals for 3 & 4 BAR PATTERN (Morning star/ Evening star). It is adjustable and it will SHOW ARROWS.
Indicator
Indices
Forex
session indicator
📈 Trading Sessions Indicator — London, New York & Tokyo Visualize Key Market Sessions + High/Low Levels with Precision
Top-rated
Free
BarSentiments
This Indicator is a technical analysis tool that measures the strength and direction of market sentiment
Order Block Detector SmartTrading
🎯 Order Block Detector - Smart Trading: Identifica bloques de órdenes clave en cTrader para un trading más inteligente.
Time To Break Even Lite Version
This is the trial version of Time To Break Even, which help you time your trade entry.
Fury Team E_M_A_su_TF
EMA ON TF (MULTI-TIMEFRAME)
SpreadCalculator - BossFXTrader
Spread Calculator to calculate the difference between two prices or values.
Indicator
RSI
Indices
StochasticRSI
Stochastic RSI (StochRSI) is a technical indicator used to measure the strength and weakness of the RSI.
Indicator
NAS100
XAUUSD
Commodities
+11
SCOB
SCOB - Single Candle Order Block Indicator