Indicator
Signal
dark-cloud
03/09/2025
97
Desktop
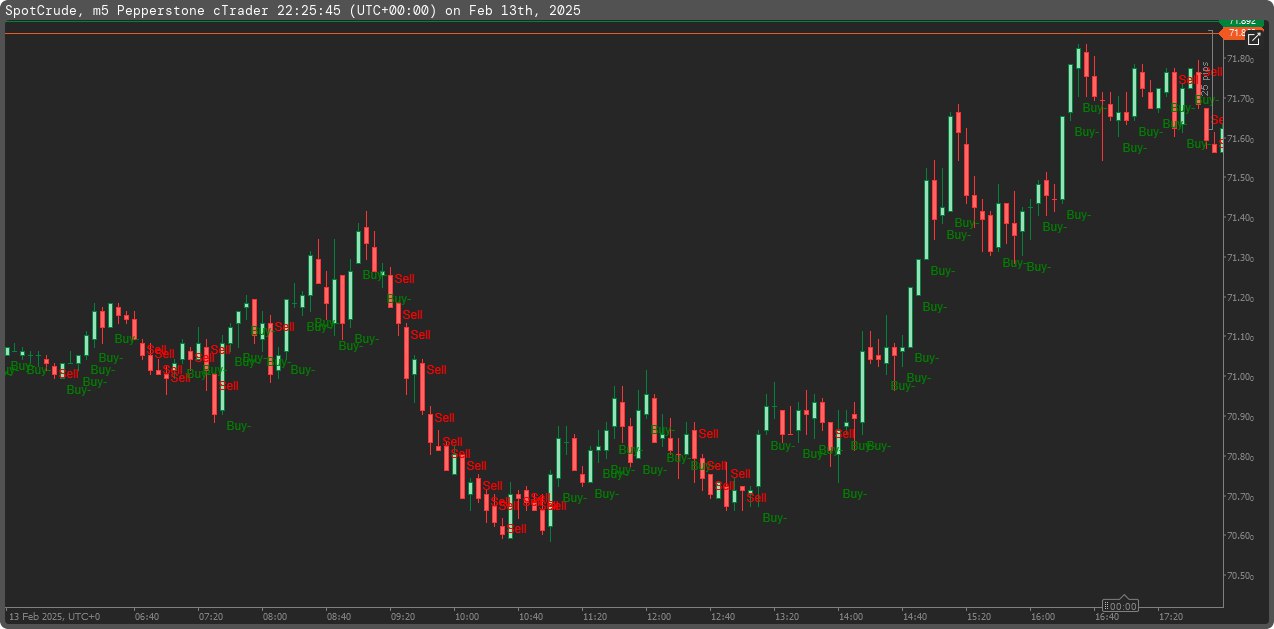
The Dark Cloud Cover indicator is a technical analysis tool designed to identify potential bearish reversal patterns in the market. This pattern consists of two consecutive candlesticks:
- A bullish (green) candle that signals strong buying momentum.
- A bearish (red) candle that opens above the previous close but closes below the midpoint of the prior candle, indicating selling pressure.
This formation suggests a potential shift in market sentiment, where buyers lose control and sellers take over.
Features & Functionality:
- Pattern Detection:
- The indicator scans for the Dark Cloud Cover pattern based on candlestick price action.
- When detected, it visually highlights the pattern to alert traders.
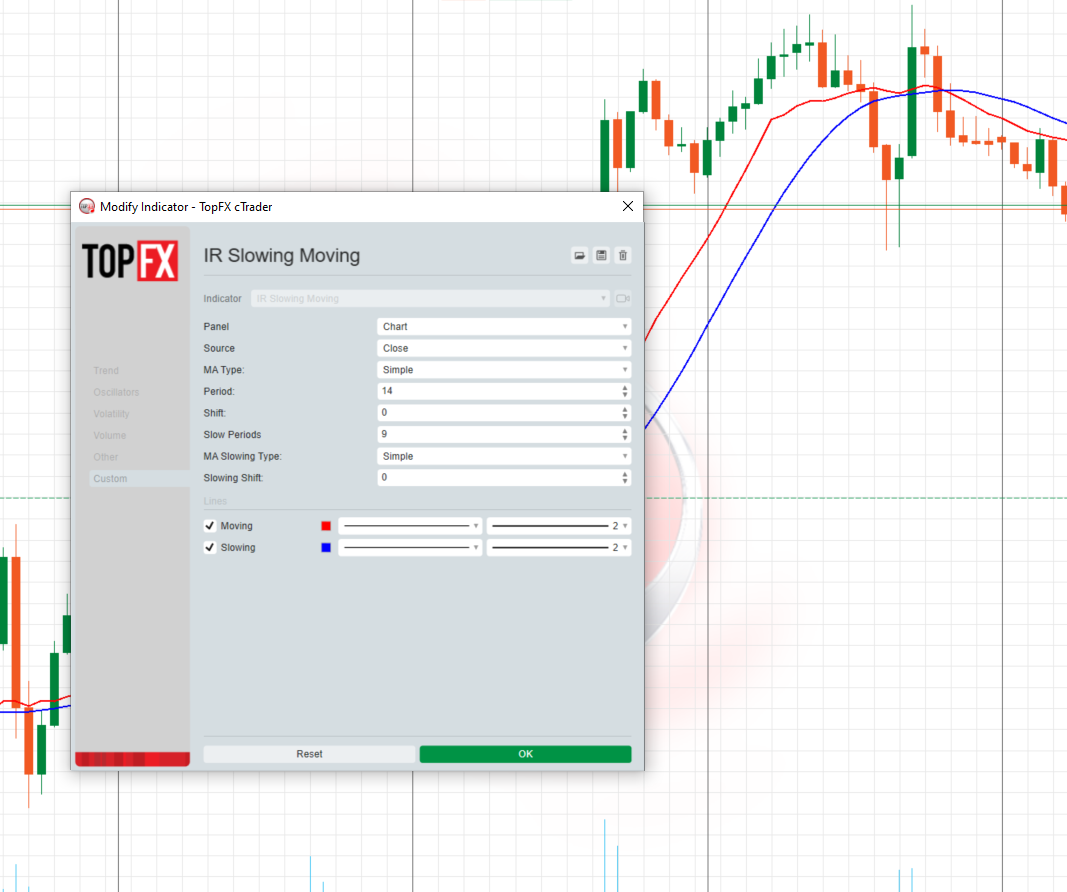
- Trend Filter (Optional):
- To improve accuracy, the indicator includes an optional trend filter using a Moving Average (MA).
- If enabled, the pattern is only considered valid when occurring in an uptrend.
- Confirmation Logic:
- The indicator can validate the bearish signal by checking the next candle.
- A confirmation candle is identified if it closes below the Dark Cloud Cover low and has higher tick volume than the average of recent candles.
- This ensures stronger reliability of the signal.
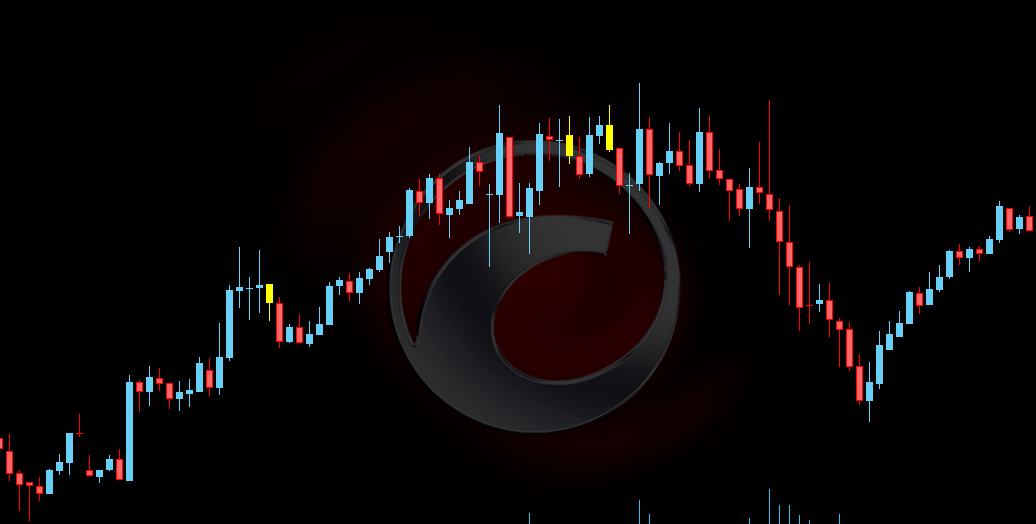
- Visual Markers:
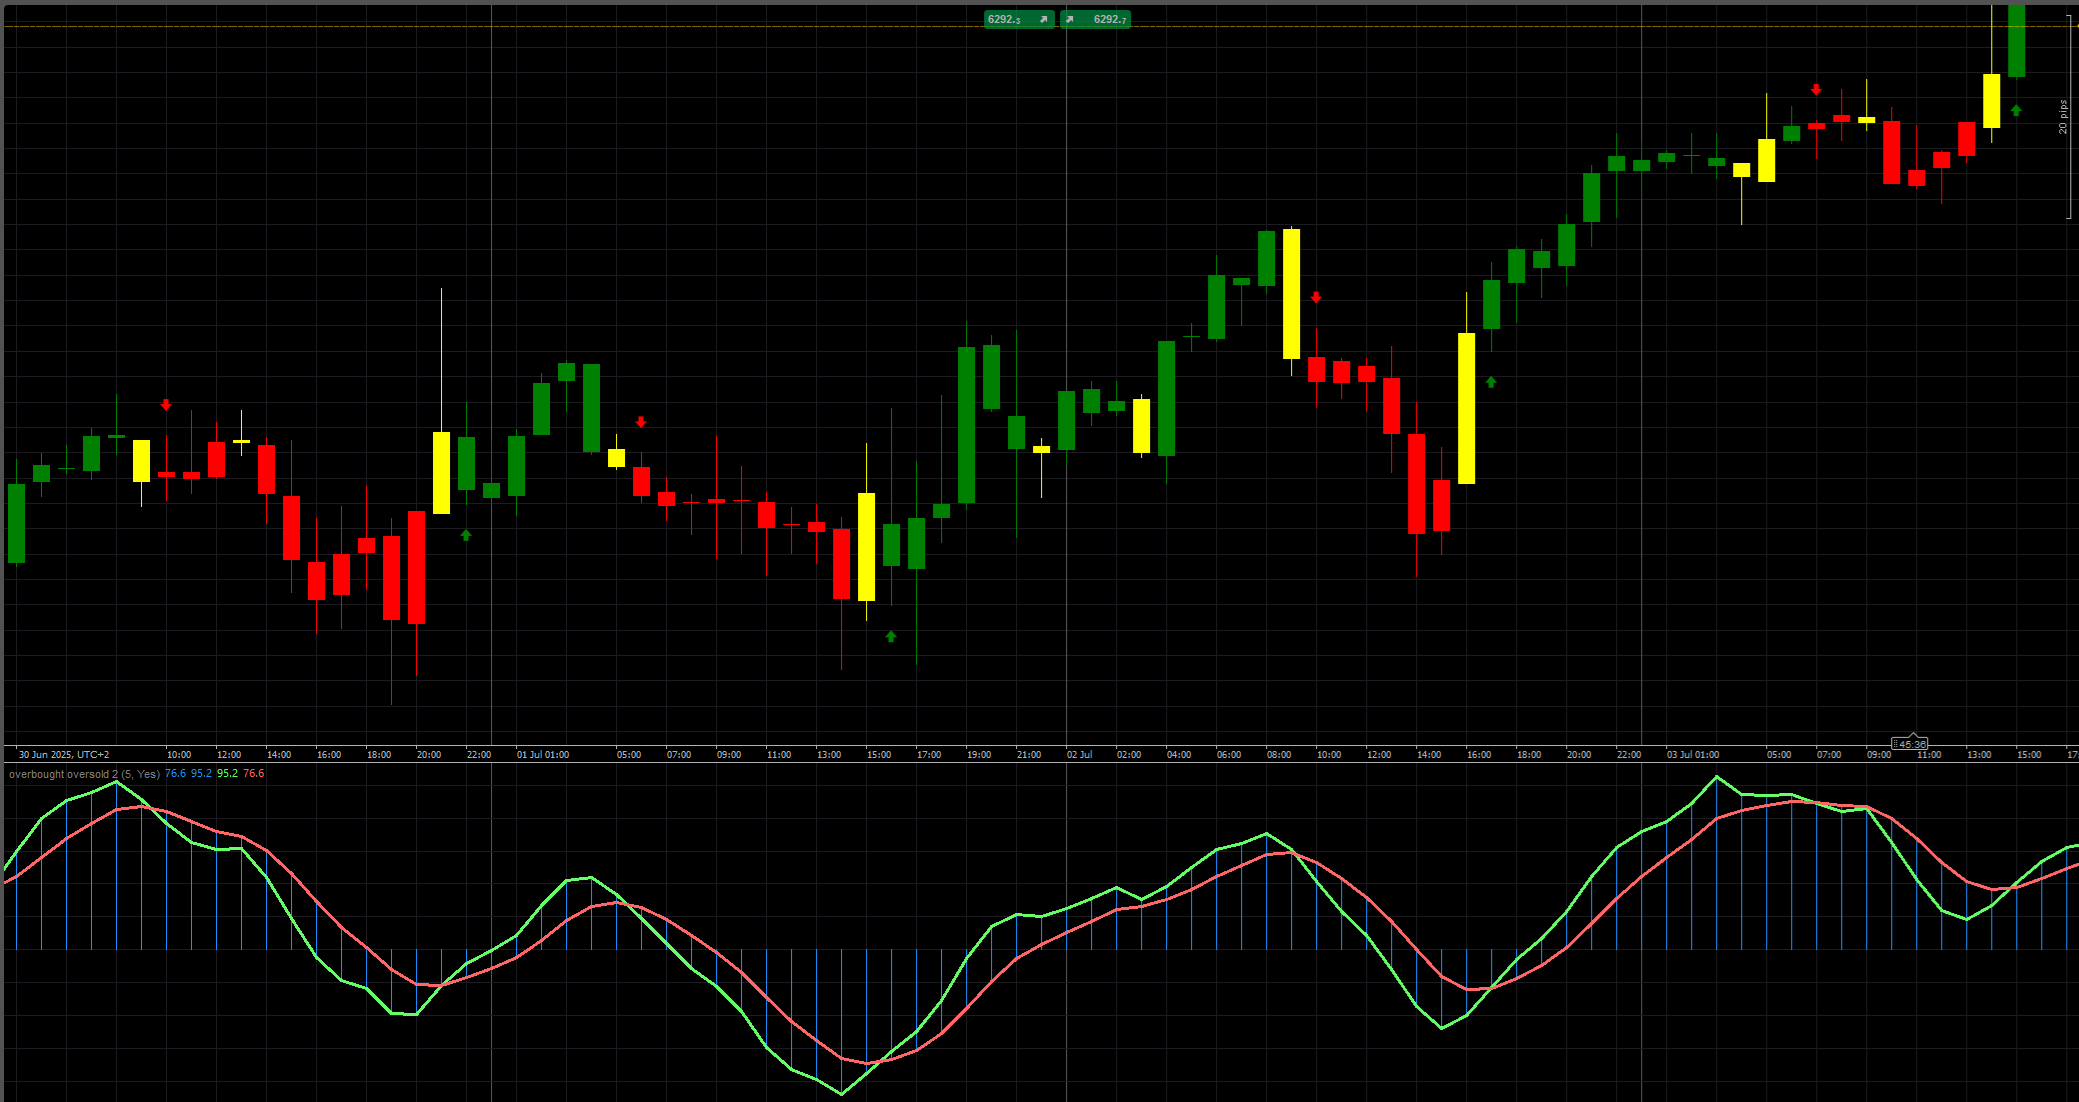
- Yellow Candles: Mark the detected Dark Cloud Cover pattern.
- Orange Candles: Highlight the confirmation candle if volume conditions are met.
This indicator helps traders spot high-probability reversal setups, improving decision-making for short entries or risk management strategies.
More from this author
You may also like