
Description
Trend Visual:
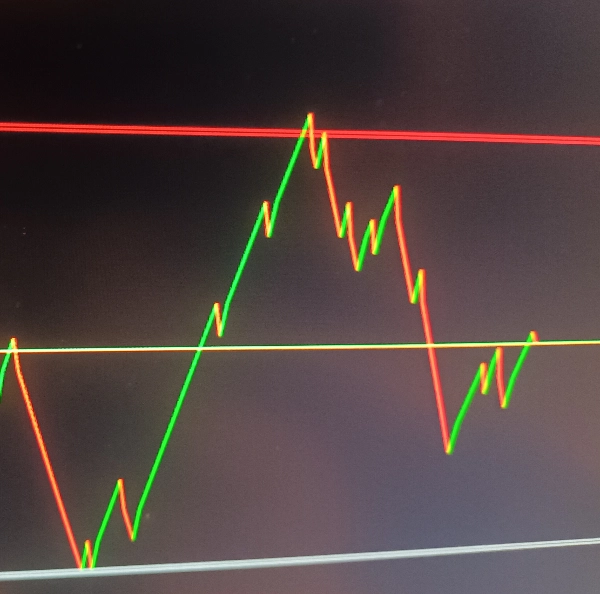
Draws trend lines (green for uptrend, red for downtrend) based on price direction changes
Plots a yellow price line on the chart
Support/Resistance Zones:
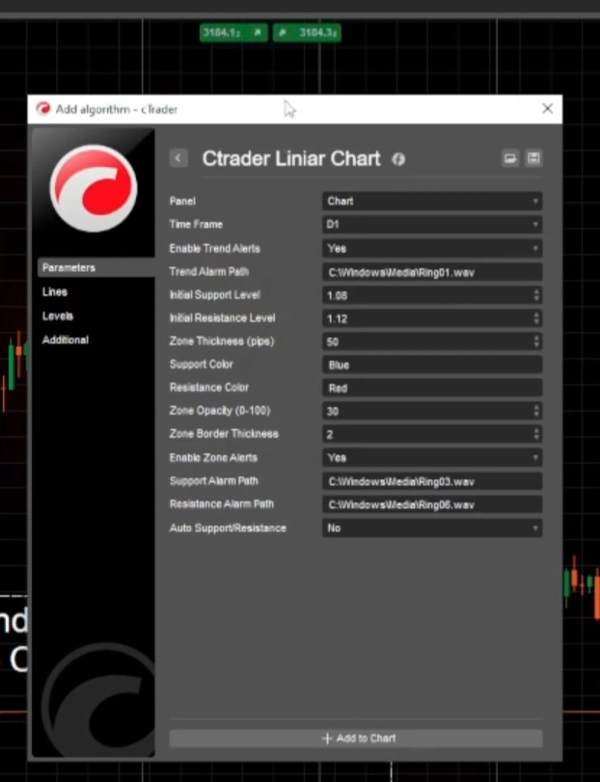
Configurable support and resistance levels with adjustable thickness (in pips)
Custom colors and opacity for the zones
Interactive zones that can be manually adjusted on the chart
Alert System:
Trend change alerts (when price direction changes)
Support/resistance zone hit alerts
Custom sound alerts for different events
Auto Support/Resistance:
Optional automatic adjustment of support/resistance levels when trends change
How It Works
Sets up the selected time frame (default is Daily)
support/resistance levels with default or user-defined values
Starts a timer to periodically check for zone adjustments
Calculation Logic
For each bar, it compares the current close price with the previous close price
Determines the current trend direction (up/down)
Draws a trend line between the current and previous prices
If the trend direction changes:
Optionally updates support/resistance levels automatically
Triggers trend alerts (if enabled)
Checks if price enters support/resistance zones and triggers alerts accordingly
Zone Management
Support/resistance zones are drawn as semi-transparent rectangles
Zones can be manually adjusted on the chart and the indicator will track these changes
Zone thickness is configurable in pips
Alert Types
Trend Alerts: Triggered when price changes direction (up/down)
Zone Alerts: Triggered when price enters support/resistance zones
Auto-Level Alerts: When auto-support/resistance is enabled, alerts when these levels are automatically adjusted
Time frame selection
Enable/disable different alert types
Custom sound file paths for different alerts
Support/resistance level .
Summary
The indicator features configurable support and resistance zones displayed as semi-transparent rectangles, with adjustable thickness in pips, customizable colors, and opacity. These zones are interactive and can be manually adjusted on the chart, with the indicator tracking any changes.
An alert system notifies users of trend changes, price entries into support/resistance zones, and automatic adjustments of these levels if the auto-support/resistance feature is enabled. Alerts can be customized with different sound files and can be enabled or disabled individually.
The indicator periodically checks for zone adjustments and updates support/resistance levels automatically when trends change, if configured. It supports time frame selection and provides a comprehensive visual and alert-based approach to monitoring price trends and critical levels in trading charts.


