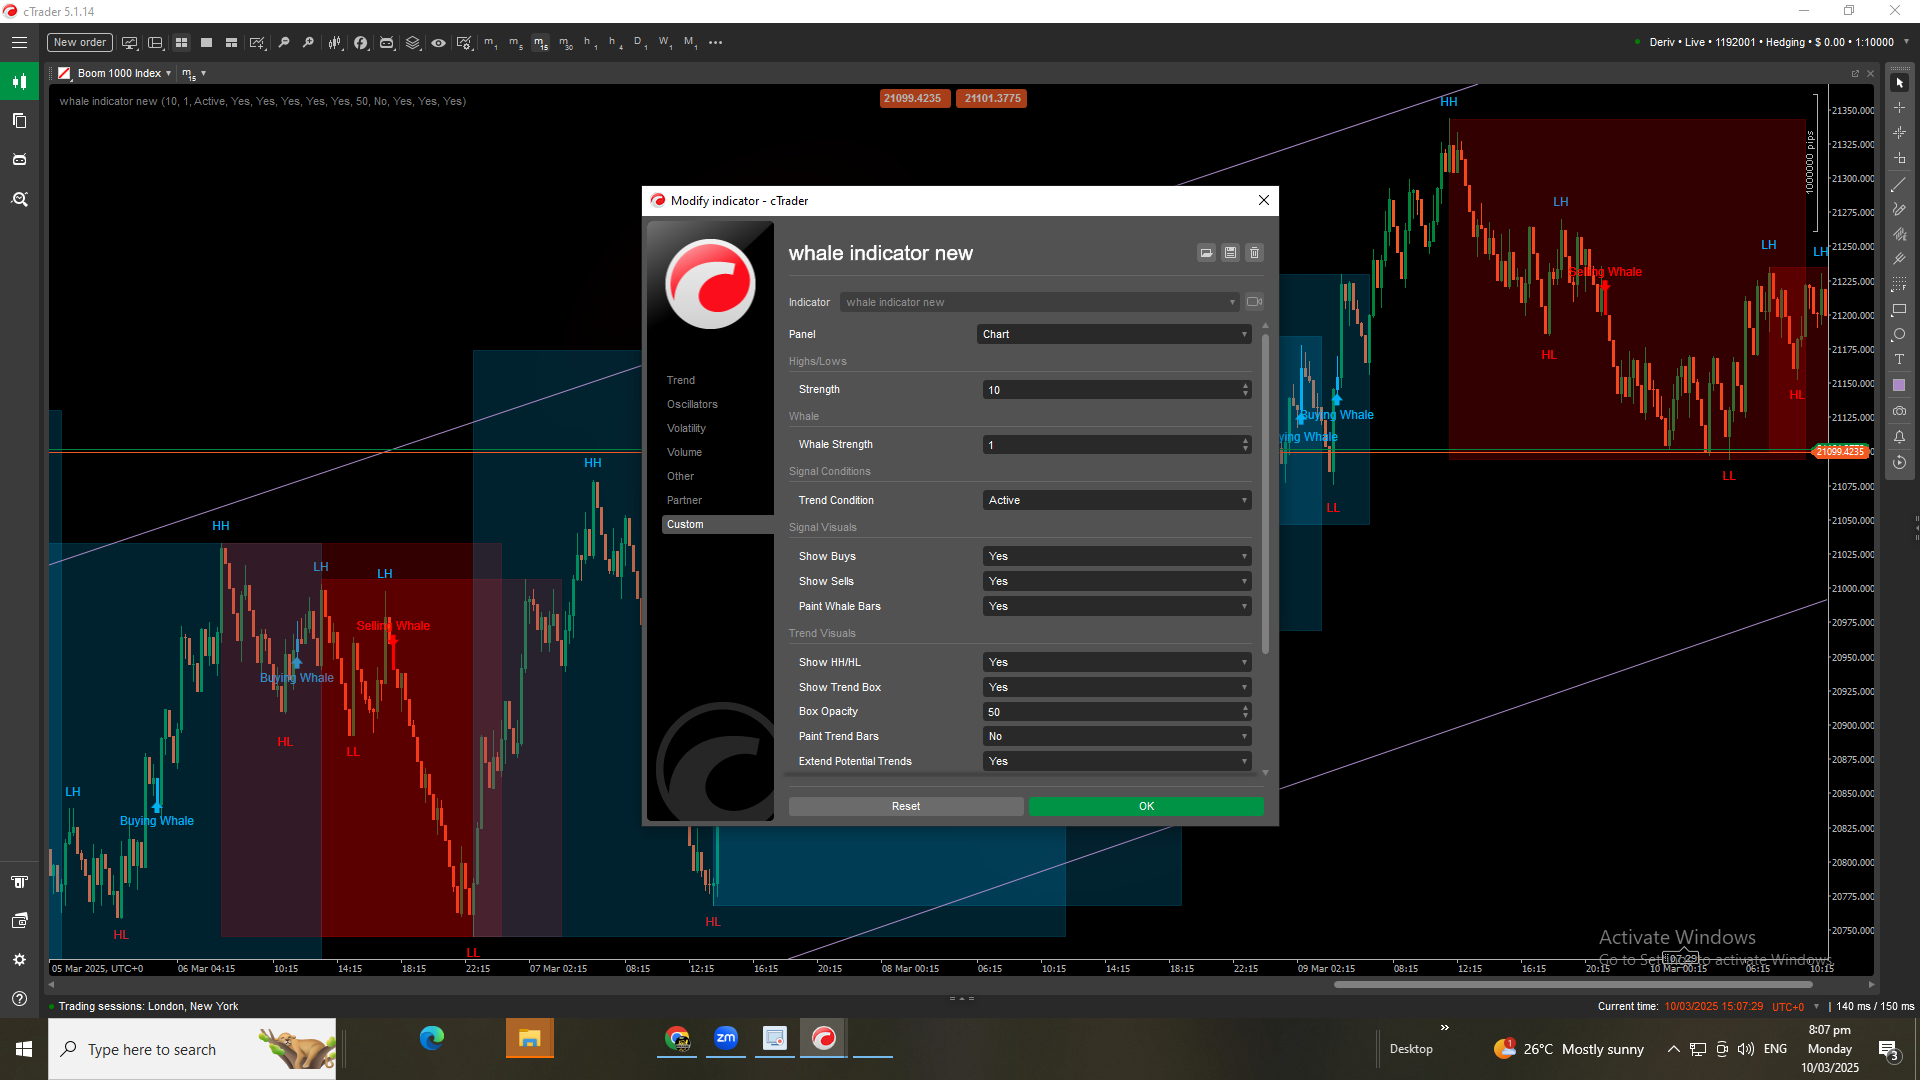
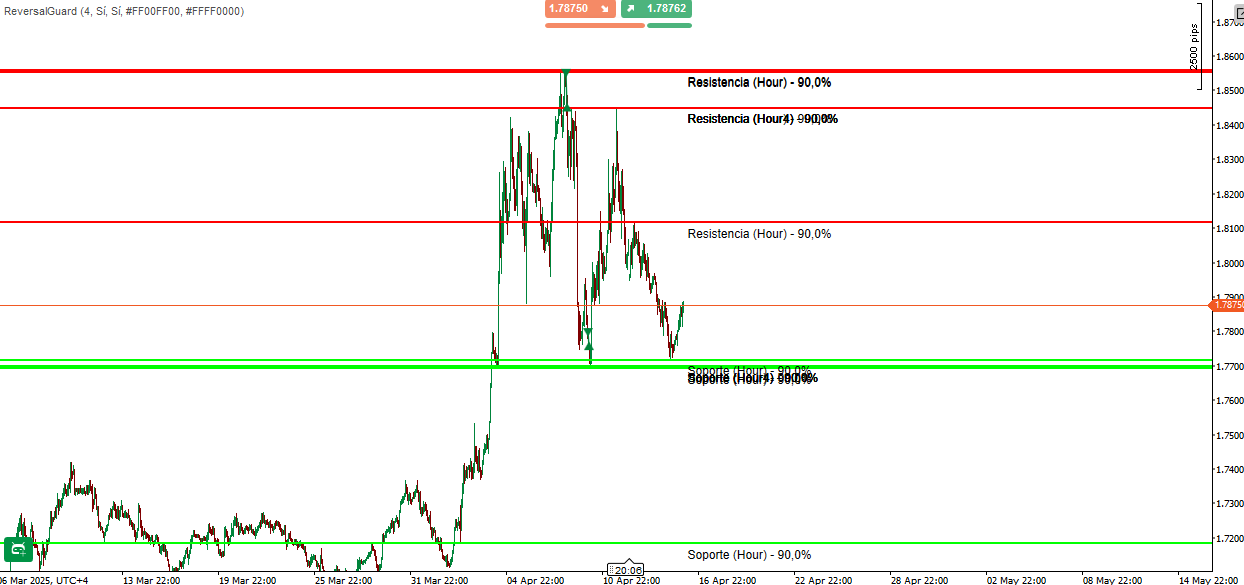
Whale Hunting Indicator – Bukhari Academy
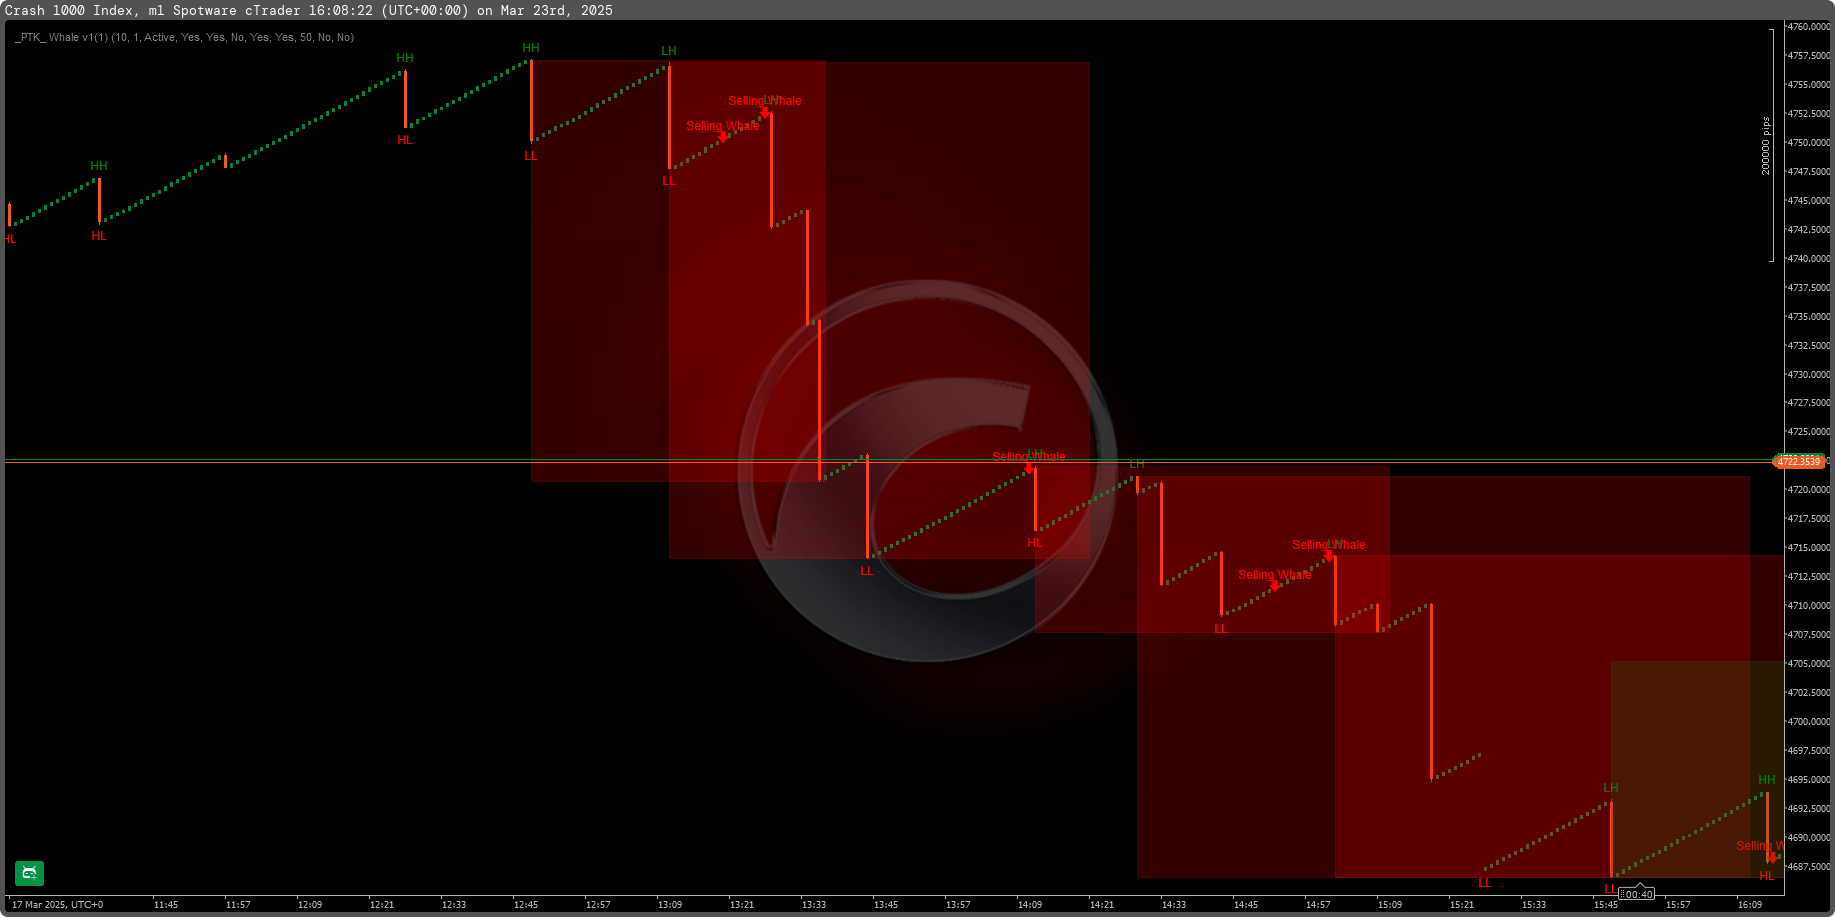
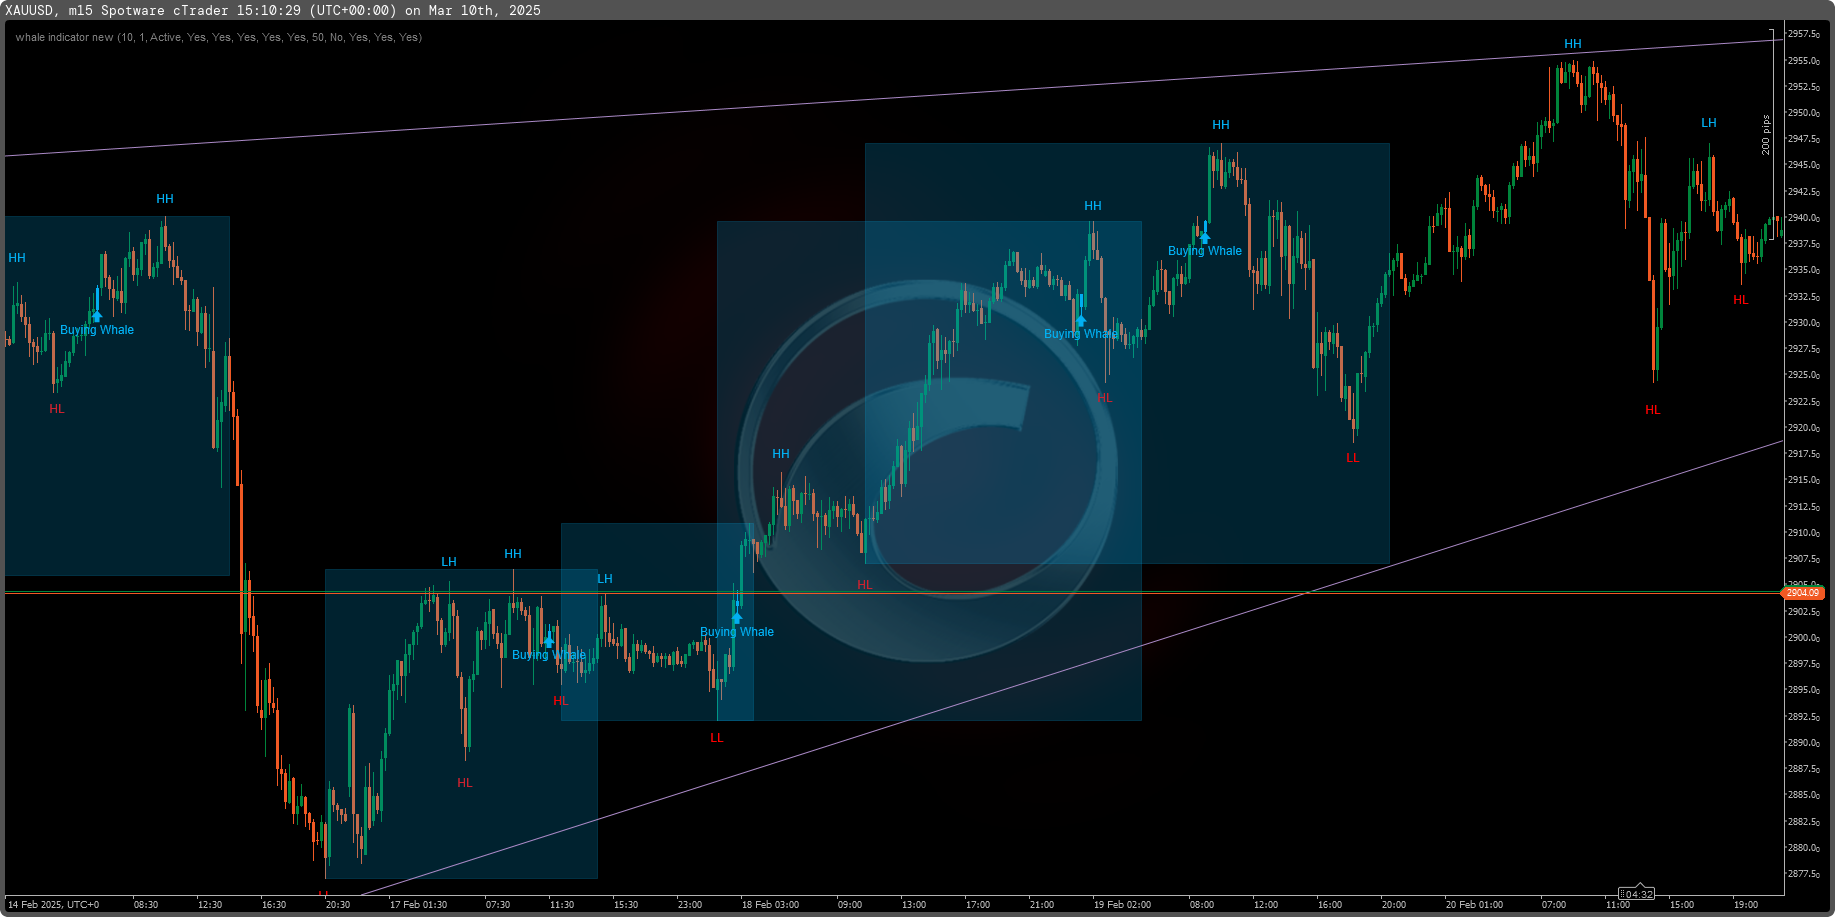
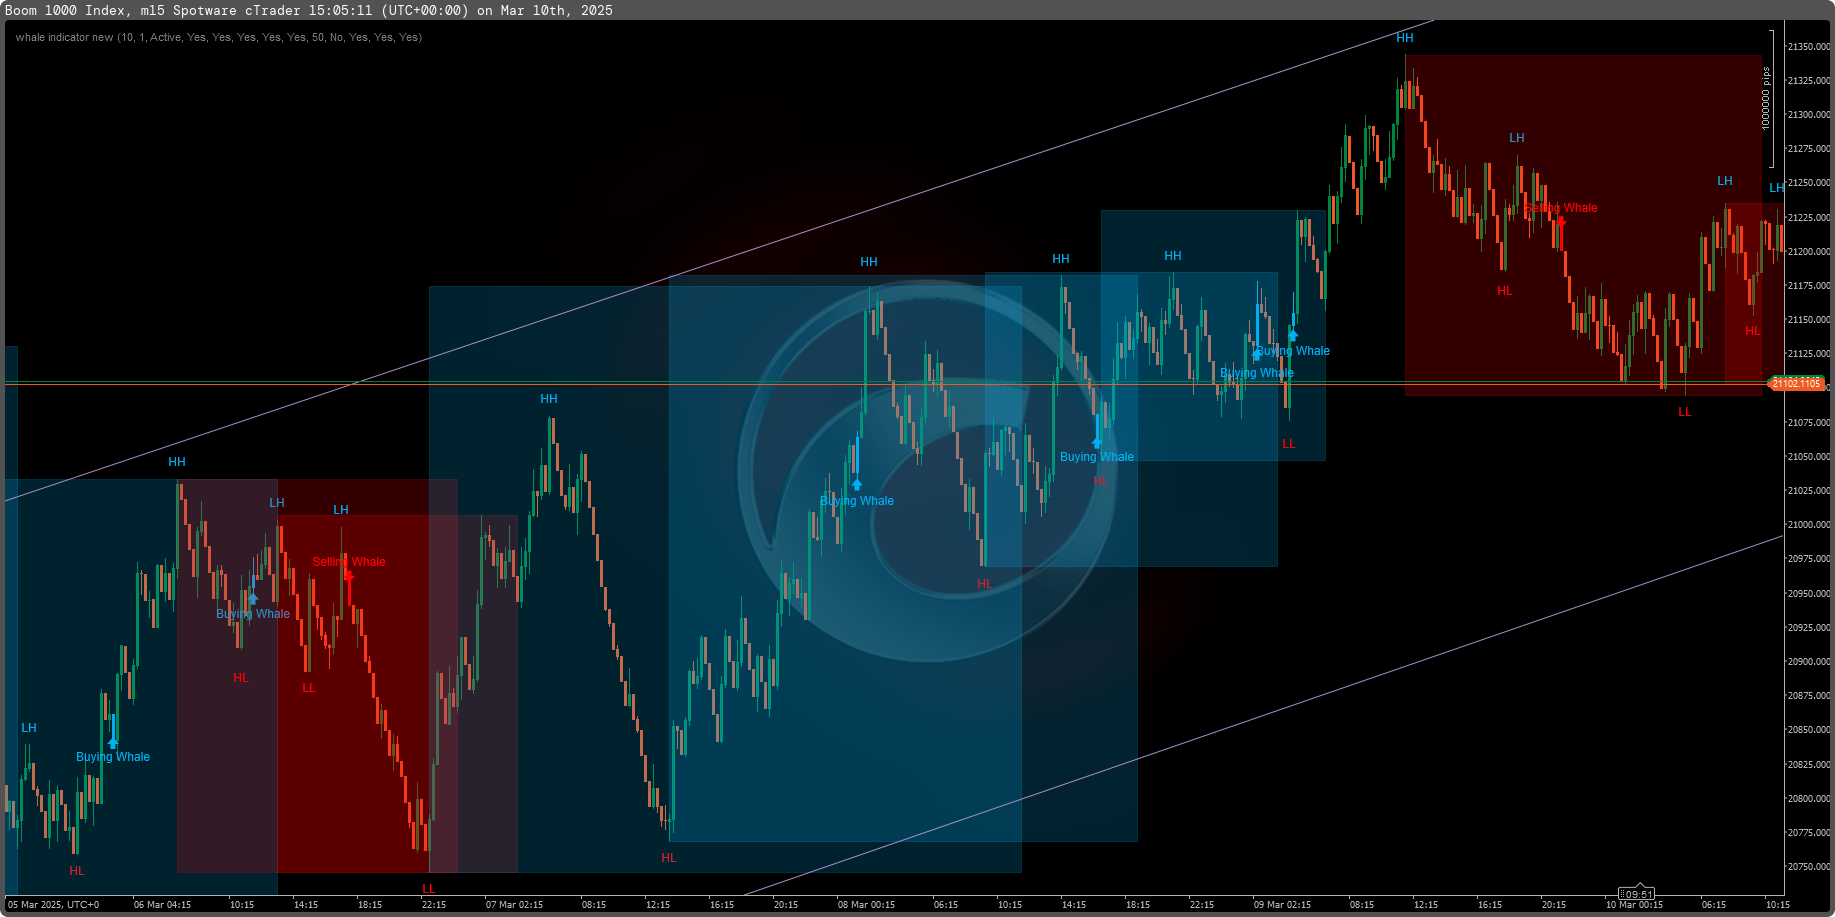
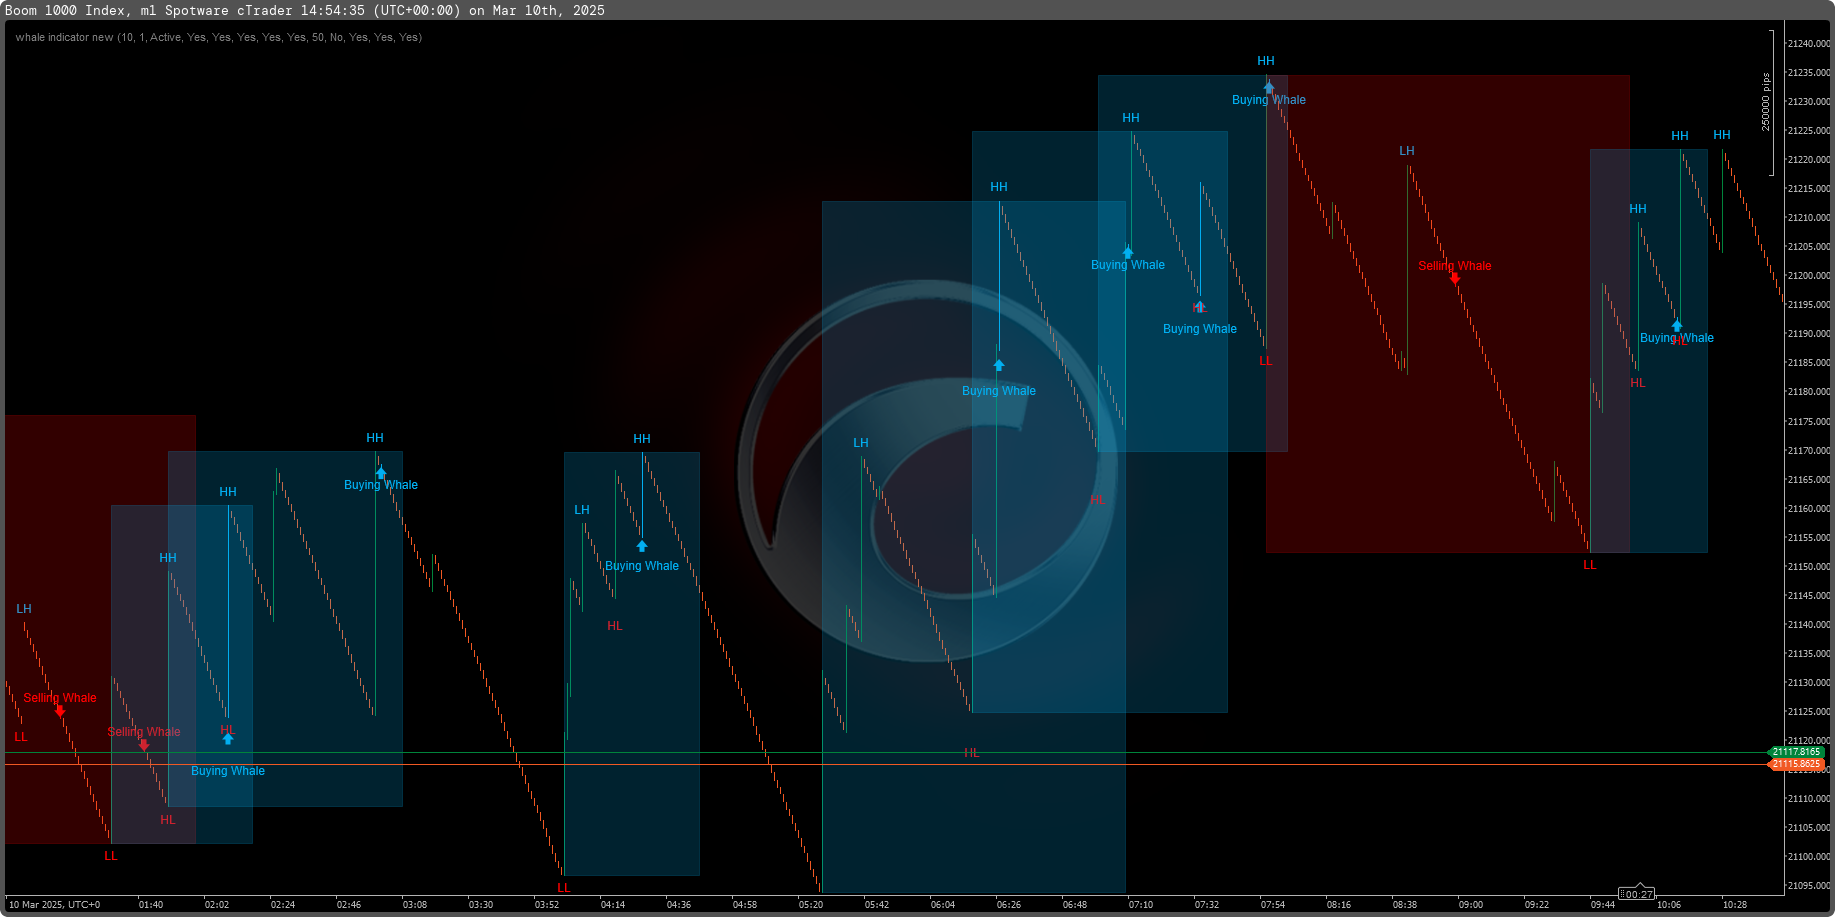
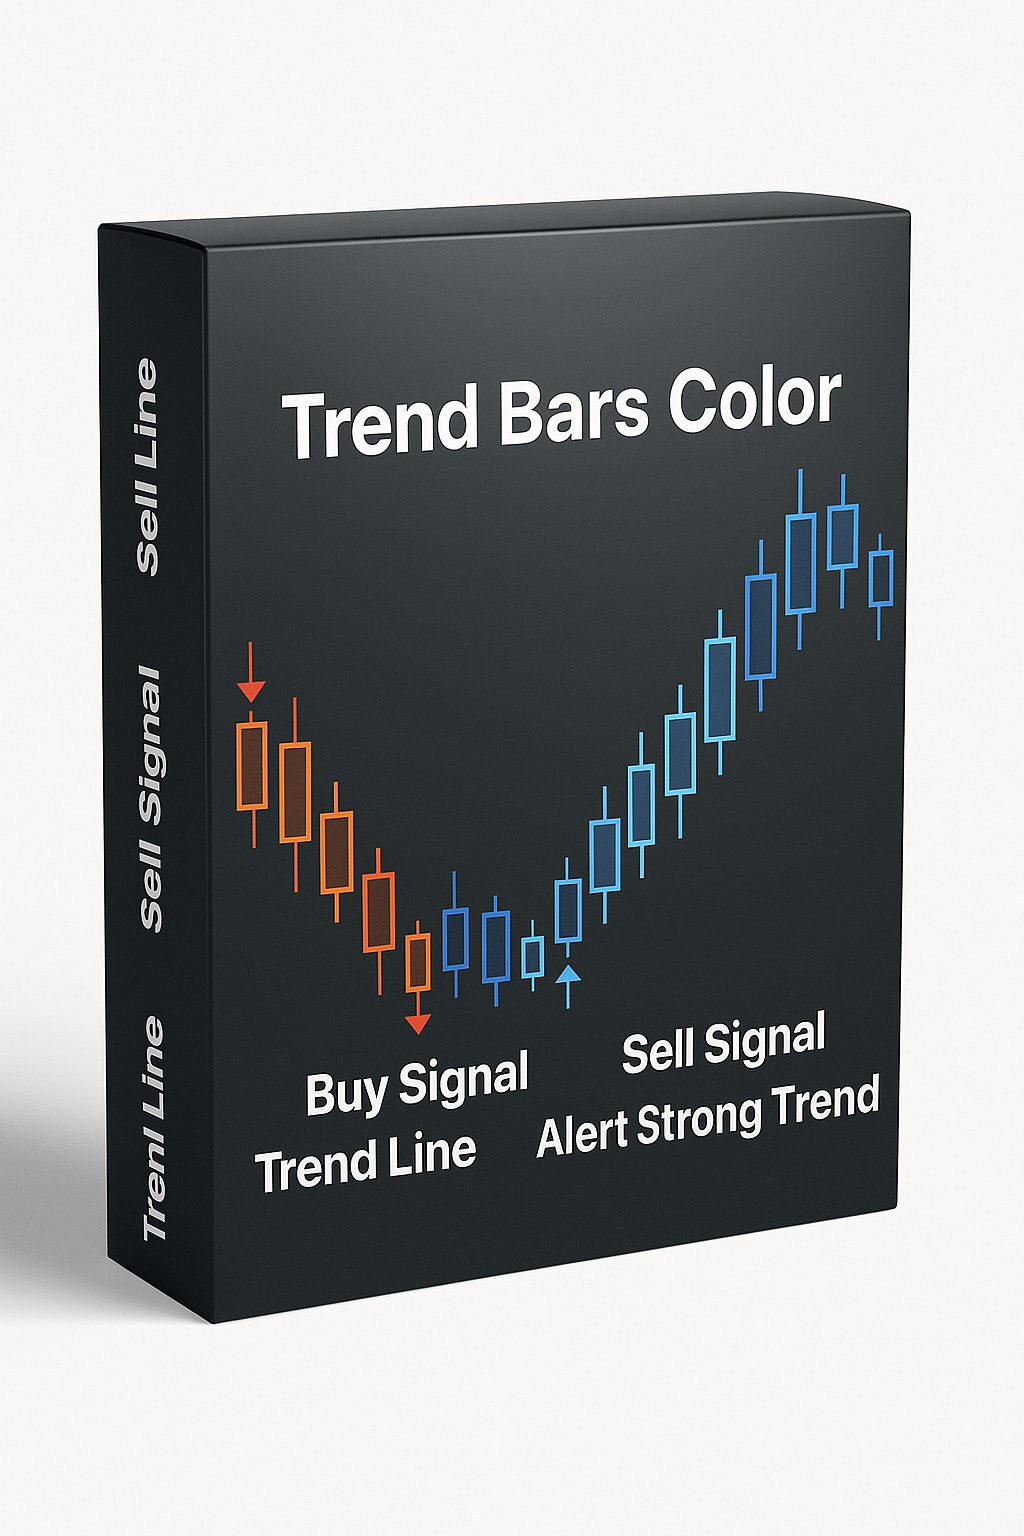
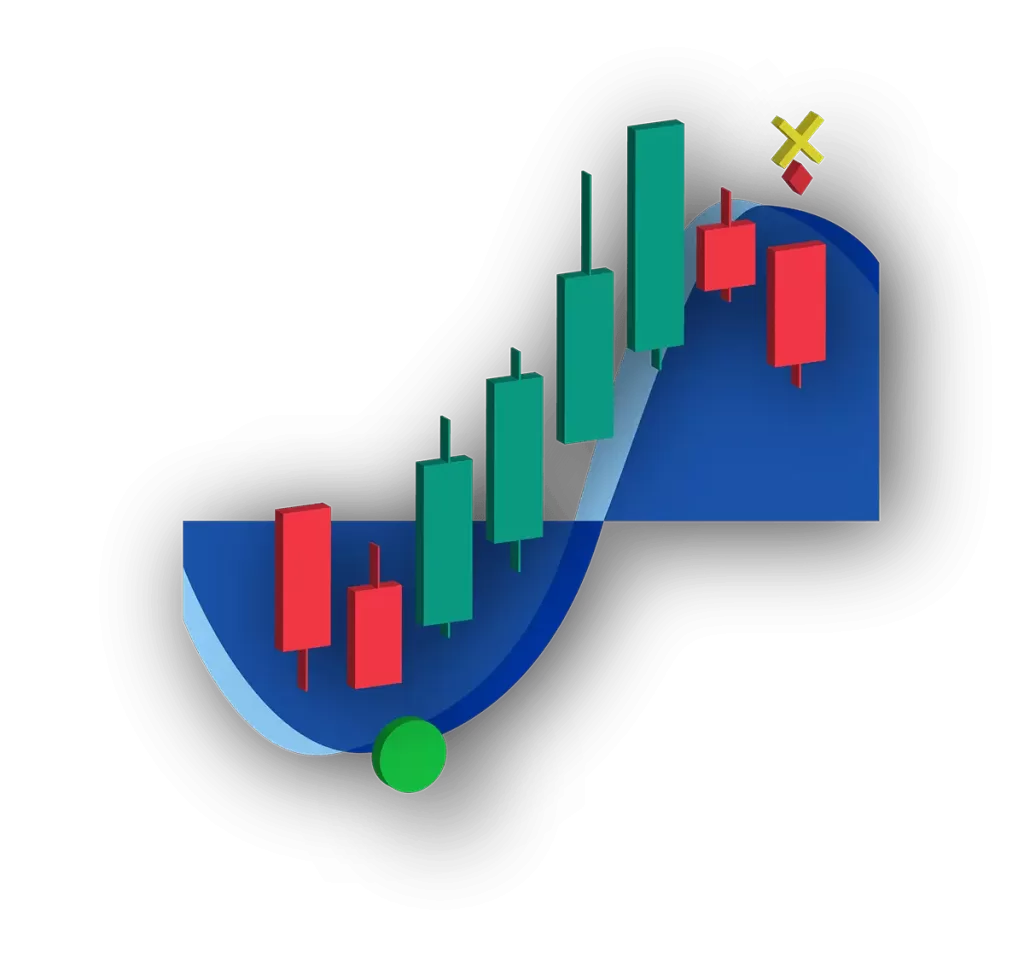
The Whale Hunting Indicator is a powerful trading tool designed specifically for Boom & Crash indices and Volatility indices. It features an Auto Trend Detector, detects bullish and bearish trends, marks market structure points (HH, HL, LH, LL), and provides high-precision buy and sell signals to help traders make informed decisions.
Key Features:
✅ Auto Trend Detector – Automatically identifies market trends, reducing the need for manual analysis.
✅ Designed for Boom & Crash and Volatility Indices – Optimized for trading these synthetic markets.
✅ Spike Detection on Boom & Crash (M1 Timeframe) – Identifies potential spikes on M1, helping traders catch rapid price movements.
✅ Trend Identification on M15 – Works effectively on M15 for normal trend analysis and structured trade setups.
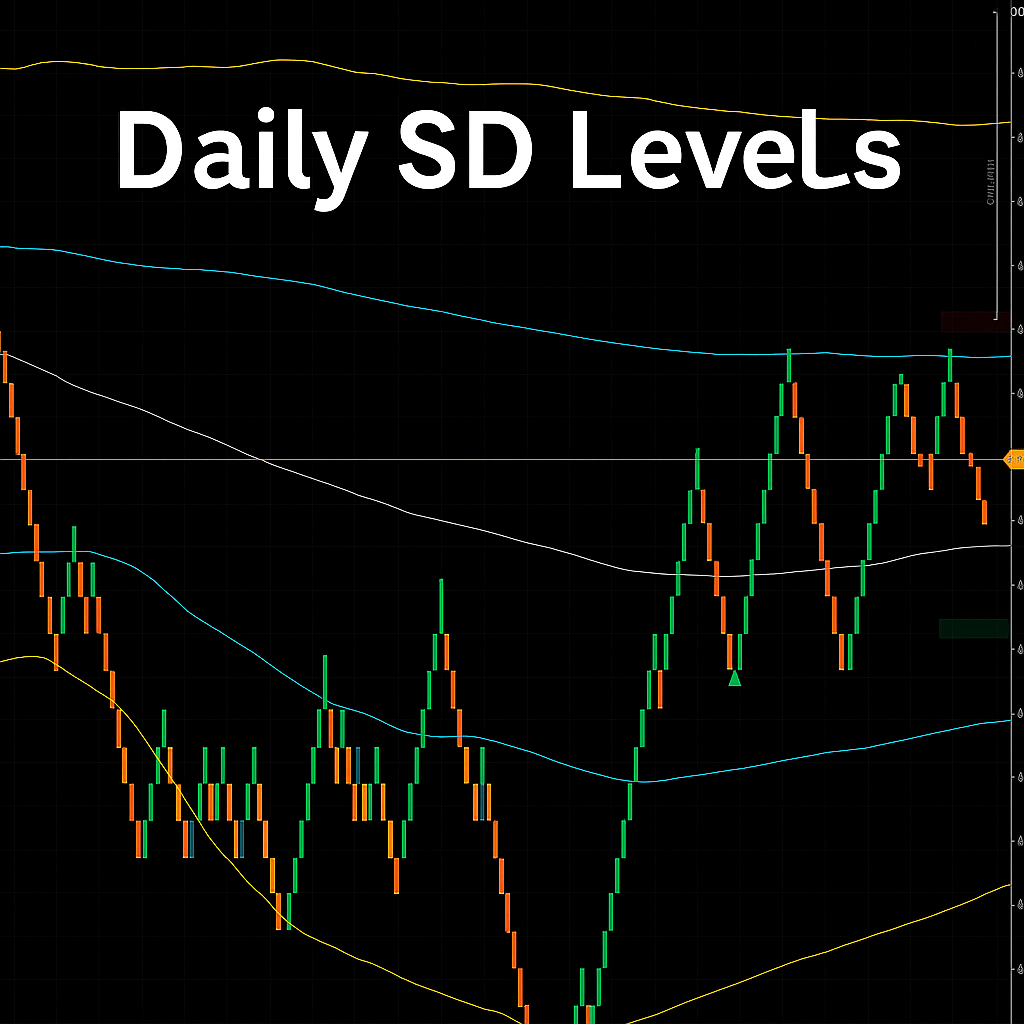
✅ Market Structure Analysis – Displays Higher Highs (HH), Higher Lows (HL), Lower Highs (LH), and Lower Lows (LL) for better trend understanding.
✅ Whale Entry Signals – Highlights "Buying Whale" and "Selling Whale" points for accurate trade entries.
✅ Fully Customizable Settings – Adjust whale strength, signal sensitivity, and trend conditions to refine your trading approach.
✅ Enable/Disable Features – Toggle trend boxes, structure points, and buy/sell signals as needed.
How to Use the Whale Hunting Indicator?
1️⃣ Auto Trend Detection – Let the indicator automatically identify the trend direction.
2️⃣ Trade Boom & Crash Spikes on M1 – Look for signals on M1 to catch price spikes efficiently.
3️⃣ Analyze Market Trends on M15 – Use M15 for structured trend analysis and trade confirmation.
4️⃣ Follow Market Structure – Use HH, HL, LH, LL to understand trend direction and strength.
5️⃣ Look for Whale Signals – Enter trades at "Buying Whale" or "Selling Whale" points.
6️⃣ Customize for Accuracy – Adjust whale strength and signal sensitivity to optimize results.
7️⃣ Enable/Disable Features – Modify trend conditions and structure settings as per your strategy.
This indicator is perfect for Boom & Crash and Volatility indices, providing high-probability trade opportunities with precision and efficiency. 🚀
!["[Hamster-Coder] Moving Average MTF" logo](https://market-prod-23f4d22-e289.s3.amazonaws.com/9aea8393-48a3-4e7d-bb1f-45905f6cf344_Icon300.jpg)

 Small.jpeg)
.jpg)
!["[Stellar Strategies] Market Session Ultimate" logo](https://market-prod-23f4d22-e289.s3.amazonaws.com/92b85b76-697c-4a8f-811f-ddd63eb8f9c8_cTrader_oSHtUgCtNJ.png)