"DMI CUSTOM SESSIONS" logo
DMI CUSTOM SESSIONS
"DMI CUSTOM SESSIONS" uploaded image

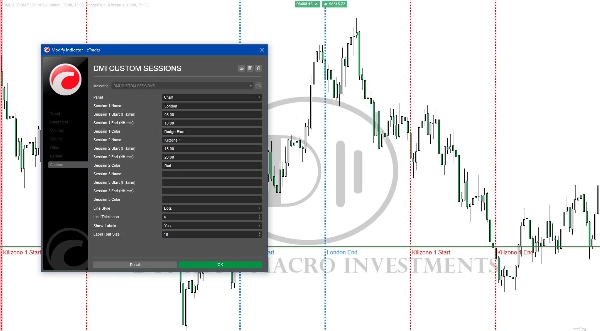
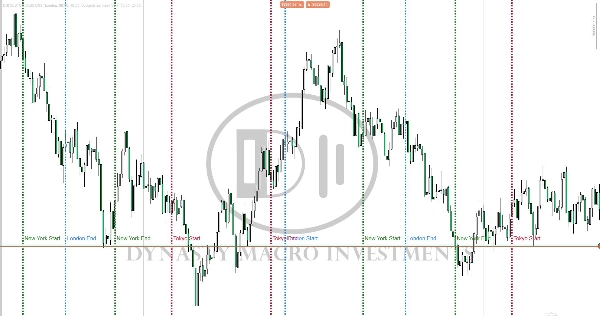
This will allow you to have SESSIONS on the chart. London, New York, Asian session and you can customize the times. You can give the session unique names and change the colors.

Indicator profile
0.0
Reviews: 0
Customer reviews
No reviews for this product yet. Already tried it? Be the first to tell others!
Products available through cTrader Store, including trading bots, indicators and plugins, are provided by third-party developers and made available for informational and technical access purposes only. cTrader Store is not a broker and does not provide investment advice, personal recommendations or any guarantee of future performance.

More from this author

Shows BUY & SELL signals for 3 & 4 BAR PATTERN (Morning star/ Evening star). It is adjustable and it will SHOW ARROWS.
Marks Monday's OPEN,HIGH & LOW. These are areas of support and resistance for the week.
Morning Star pattern on chart (Bullish and Bearish) automatically marked with (BUY & SELL) Very powerful signals.

You may also like

Liquidity sweeps without clutter. Equal highs/lows pools, sweeps + reclaim, filters + compact panel. StepSize-based.
Price Action Zone shows previous D/W/M key levels to help frame intraday price action, liquidity, and market structure.
Stochastic RSI (StochRSI) is a technical indicator used to measure the strength and weakness of the RSI.
A straightforward yet effective tool signals entry points for both buying and selling. It incorporates FVG...
Block Liquidity,indicator.Block Order, Liquids Stops, Signal Sentiment,signal correction
A volatility-adaptive trend-following indicator that dynamically adjusts to market conditions.
Perfect Trend
Single-line JPY Strength Indicator: Track yen momentum swiftly across key pairs—achieve clarity in your forex trades!
ZigZag filters noise, spots trends, patterns, pivots, aiding analysis, trade management, and confirmations. 📉📈
Z-Score: Measures price deviations from its mean. Spots overbought/sold (±2-3 SD) & reversals. Key for stats trading
🚀See the market’s framework, decide faster. Session-Aware Pivots. Auto Presets. Pro-Grade Zones.🚀
Unique Pyramid Design , Clear Price Action Trend
The Triple Momentum indicator for cTrader is a versatile trend-following tool.
buy and sell
It draws Pivot Levels on the chart.
VegaXLR's cTrader StochRSI identifies overbought/oversold RSI levels for precise trade entries.
PVA Volume Analysis Indicator:Price volume over trend strength and direction
Auto-detect support and resistance & structure, highlight pullbacks/BOS retests, and filter with candle confirmation.