
Descripción
MarketSessions – Tu ventaja en el trading, visualizada
Convierte el tiempo del mercado en poder para operar
MarketSessions es un indicador profesional para cTrader que da vida a las sesiones del mercado global — para que puedas operar donde el momentum es real y el tiempo se convierte en tu ventaja.
🚀 Por qué los traders confían en MarketSessions
Ve el ritmo del mercado
Visualiza al instante Londres, Nueva York, Tokio, Sídney – y cualquier otra sesión que desees – con superposiciones limpias y elegantes que se adaptan a tu gráfico.
Opera de manera más inteligente, no más tarde
Recibe notificaciones en tiempo real cuando las sesiones abren, cierran o alcanzan niveles clave – enviadas a través de Telegram o Discord (a tu elección).
Ataca zonas de alta probabilidad
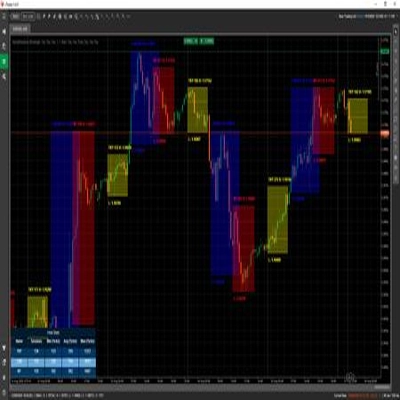
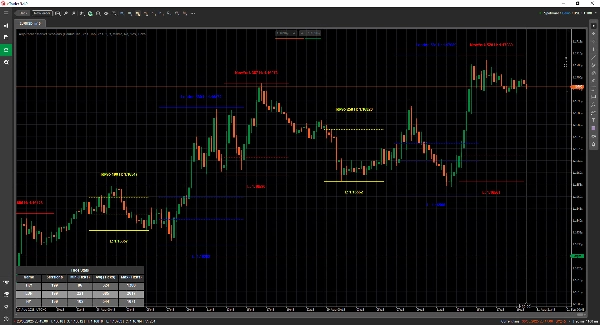
Aprovecha herramientas integradas como el Ruptura del Rango de Apertura, Punto de Control (POC) y líneas de sesión de precisión para que nunca te pierdas una ruptura o rechazo.
🎯 Características clave
- Visualización y gestión de sesiones – tiempos, colores y etiquetas totalmente personalizables, incluso para mercados superpuestos
- Herramientas avanzadas de dibujo – incluye dibujadores de línea doble ❘❘ y línea media, rectángulos de ruptura, marcadores de texto y un Modo de Línea Doble para traders minimalistas
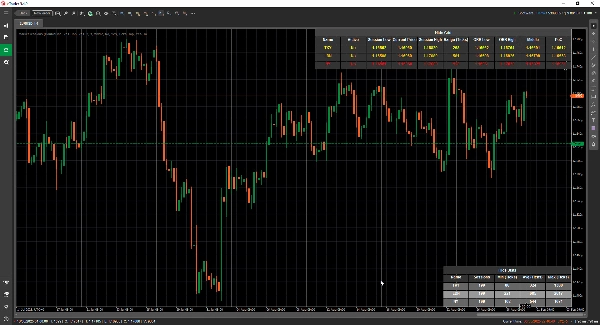
- Panel de estadísticas – visualiza sesiones totales, rangos mínimos, promedio y máximos para cada sesión (en ticks, pips o %)
- Modo de cuadrícula - te permite ver las sesiones activas actuales en una tabla, para que puedas ver las sesiones en un marco temporal superior.
- Configuración flexible – personaliza la ubicación del texto, modos de rango, preferencias de dibujo y temas
- Alertas e integraciones – integración con Telegram/Discord con alertas sonoras y visuales
📦 Lo que obtienes
- MarketSessions.algo (listo para usar)
- Actualizaciones de por vida (sin cuotas recurrentes)
- Soporte amigable (acceso directo si necesitas ayuda)
💻 Requisitos
- Plataforma cTrader
- Runtime .NET 6.0
✅ Instala en minutos
✅ Opera con absoluta confianza
📘 Referencia de parámetros (versión amigable)
Lista de sesiones disponibles
- Nueva York
- Londres
- Fráncfort
- Tokio
- Hong Kong
- Shanghái
- Singapur
- Wellington
- Sídney
- Toronto
Configuraciones generales
- Modo de dibujo – Elige cómo se dibujan las líneas de sesión en el gráfico (Rectángulo / Línea doble / Línea media)
- Mostrar nombre de sesión – Muestra el nombre de cada sesión directamente en tu gráfico
- Ubicación del nombre de sesión – Decide dónde aparece el texto del nombre de la sesión (arriba, centro, abajo)
- Texto en negrita – Hace que el nombre de la sesión esté en negrita para facilitar la lectura
- Desplazamiento superior del texto – Añade espacio extra desde arriba (para que el texto no se superponga con las velas)
- Desplazamiento inferior del texto – Añade espacio extra desde la parte inferior del área de la sesión
- Ubicación del tiempo del texto – Muestra la hora de la sesión junto con el nombre de la sesión
- Usar nombre corto de sesión – Cambia a nombres más cortos (por ejemplo, NY en lugar de Nueva York)
- Mostrar rango de sesión – Resalta el rango completo de precios cubierto por la sesión
- Modo de rango de sesión – Elige cómo se calcula el rango de precios (alto/bajo o apertura/cierre)
- Ubicación del rango de sesión – Coloca el marcador de rango ya sea en la parte superior o inferior del rango
- Mostrar máximo – Muestra el precio más alto de la sesión
- Ubicación del máximo – Elige dónde aparece la etiqueta de máximo
- Mostrar mínimo – Muestra el precio más bajo de la sesión
- Ubicación del mínimo – Elige dónde aparece la etiqueta de mínimo
- Extender líneas de máximo/mínimo (minutos) - Permite extender estas líneas hacia adelante por x minutos
- Mostrar ruptura del rango de apertura – Dibuja un cuadro de ruptura en la apertura de la sesión
- Extender líneas ORB (minutos) - Permite extender estas líneas hacia adelante por x minutos
- Mostrar líneas medias – Añade líneas medias para ayudar a identificar el valor justo
- Extender líneas medias (minutos) - Permite extender esta línea hacia adelante por x minutos
- Mostrar PoC – Muestra el Punto de Control (precio más negociado de la sesión)
- Extender líneas medias (minutos) - Permite extender esta línea hacia adelante por x minutos
- Transparencia del relleno – Controla cuán transparente es el relleno de fondo de la sesión
Estadísticas
- Dibujar estadísticas – Mostrar/ocultar el panel de estadísticas en tu gráfico
- Alineación horizontal de estadísticas – Alinea el panel (Izquierda / Centro / Derecha)
- Alineación vertical de estadísticas – Elige si el panel aparece arriba o abajo
- Color del título – Color del texto para el título “Estadísticas”
- Color de filas pares – Color de fondo para las filas pares en el panel
- Color de filas impares – Color de fondo para las filas impares en el panel
- Color de primer plano – Color del texto usado dentro del panel
Telegram
- Usar – Habilitar o deshabilitar alertas de Telegram
- Token – Tu token de bot de Telegram
- ChatId – El ID del chat donde se enviarán las alertas
Discord
- Usar – Habilitar o deshabilitar alertas de Discord
- WebhookUrl – URL del webhook de Discord para enviar alertas de sesión
Alertas sonoras
- Alerta sonora de nueva sesión – Reproduce un sonido cuando comienza una nueva sesión
- Alerta sonora de sesión completada – Reproduce un sonido cuando termina una sesión
Cuadrícula
- Forzar cuadrícula - Fuerza el renderizado de la cuadrícula independientemente del marco temporal usado
- Cuadrícula visible para marco temporal superior - Te permite seleccionar a partir de qué marco temporal esta cuadrícula es visible
- Notificación en cuadro de mensaje - Notifica por qué no es posible el modo de renderizado normal y cambia al modo cuadrícula
- Alineación horizontal de la cuadrícula
- Alineación vertical de la cuadrícula
Ejemplo de sesión (Nueva York)
⚠️ Los mismos parámetros se aplican a cada sesión (Londres, Tokio, Sídney, etc.)
- Activo – Habilita o deshabilita esta sesión específica
- Color – Color de la sesión usado en el gráfico
- Rellenar región – Rellena el fondo del área de la sesión
- Estilo de línea – Elige el estilo de línea (sólido, punteado, etc.)
- Grosor de línea – Controla el grosor de los bordes de la sesión
Haz del reloj del mercado tu aliado
Obtén MarketSessions hoy y nunca más pierdas una sesión rentable.


