
Descripción
Pressure Scanner 🔍📊
1. Qué hace Pressure Scanner
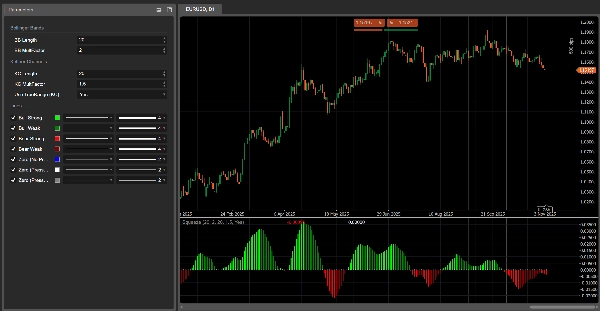
Pressure Scanner es una herramienta de volatilidad y dirección que:
- detecta cuando el mercado está bajo presión/compression de volatilidad ✅
- muestra cuando esa presión es liberada hacia la expansión 💥
- mide la dirección y fuerza del impulso de precio resultante a través de un valor del escáner representado como un histograma.
Combina:
- una banda de precio estilo Bollinger,
- un canal de volatilidad estilo Keltner,
- y una línea del escáner basada en regresión lineal,
para mostrar tanto los estados de presión (activada / liberada / neutral) como el impulso direccional (hacia arriba o hacia abajo).
2. Cómo funciona (lógica)
- Fuente
El indicador usa el precio de cierre como entrada principal. - Banda de volatilidad externa (estilo BB)
-
- Base = SMA(close,
BB Length) - Desviación =
KC MultFactor× desviación estándar del cierre - Banda superior = base + desviación
- Banda inferior = base − desviación
- Base = SMA(close,
- Canal de volatilidad interno (estilo KC)
-
- Centro = SMA(close,
KC Length) - Rango = ya sea True Range o High−Low (establecido por
Use TrueRange) - Promedio del rango = SMA(rango,
KC Length) - Canal superior = centro + rangoProm ×
KC MultFactor - Canal inferior = centro − rangoProm ×
KC MultFactor
- Centro = SMA(close,
- Estados de presión
Comparando la banda externa y el canal interno: -
- Presión ACTIVADA – puntos negros en cero
-
- Banda inferior > canal inferior y banda superior < canal superior
- La banda está completamente dentro del canal → la volatilidad está comprimida, alta presión.
- Presión LIBERADA – puntos grises en cero
-
- Banda inferior < canal inferior y banda superior > canal superior
- La banda está completamente fuera del canal → la volatilidad está expandiéndose después de la presión.
- Presión neutral – puntos azules en cero
-
- Cualquier otra configuración.
- Valor del escáner (
val)
El histograma muestra un valor del escáner calculado mediante regresión lineal: -
- Durante las últimas
KC Lengthbarras, el indicador encuentra: -
- máximo alto,
- mínimo bajo,
- SMA del cierre.
- Construye una línea media dinámica:
-
- rangoMedio = (máximo + mínimo) / 2
- combinadoMedio = promedio(rangoMedio, SMA(cierre))
- Luego define:
scannerInput=close−combinedMid\text{scannerInput} = \text{close} - \text{combinedMid}scannerInput=close−combinedMid - Se ejecuta una regresión lineal sobre
KC Lengthbarras en estescannerInput, y el valor final en la última barra es el valor del escánerval.
- Durante las últimas
Interpretación:
val > 0→ el precio está presionando por encima de la línea media → presión alcistaval < 0→ el precio está presionando por debajo de la línea media → presión bajista- cambios en
valbarra a barra → aumento o disminución en esa presión direccional.
3. Cómo leer los colores
Histograma – presión direccional (valor del escáner)
Cada barra del histograma corresponde a val y está coloreada como:
- Lima –
val > 0y en aumento (val > val anterior)
→ fuerte presión alcista, valor del escáner fortaleciéndose hacia arriba. - Verde –
val > 0pero cayendo (val ≤ val anterior)
→ aún alcista, pero la presión está disminuyendo. - Rojo –
val < 0y cayendo más (val < val anterior)
→ fuerte presión bajista, impulso descendente intensificándose. - Granate –
val < 0pero en aumento (val ≥ val anterior)
→ aún bajista, pero la presión está perdiendo fuerza.
Entonces:
- Por encima de 0 → régimen de presión alcista
- Por debajo de 0 → régimen de presión bajista
- Cambio de color en el mismo lado de 0 = presión acelerando vs desacelerando.
Línea cero – estados de presión
Los puntos representados en cero muestran el estado de presión:
- Azul – presión neutral (volatilidad normal)
- Negro – Presión ACTIVADA (compresión activa)
- Gris – Presión LIBERADA (expansión tras compresión)
4. Referencia de parámetros (Inglés)
BB Length
Periodo para la SMA y desviación estándar usada en la banda de volatilidad externa.
- Más corto → banda más reactiva, cambios de presión más frecuentes.
- Más largo → banda más suave, señales menos frecuentes pero más “macro”.
BB MultFactor
Multiplicador para la desviación de la banda externa (mantenido como parámetro de usuario para flexibilidad).
En este puerto, el comportamiento de la desviación está ligado a KC MultFactor como en la fórmula original, pero puedes adaptarlo si deseas un estilo de banda diferente.
KC Length
Periodo para:
- la línea central del canal de volatilidad,
- el suavizado del rango,
- la ventana alto/bajo y la regresión del escáner.
Define qué tan atrás mira Pressure Scanner para estimar la estructura de volatilidad y presión direccional.
KC MultFactor
Controla el ancho del canal de volatilidad y la banda externa.
- Valor mayor → canal más ancho, menos estados de Presión ACTIVADA.
- Valor menor → canal más estrecho, señales de presión más frecuentes.
Usar TrueRange (KC)
- true → el rango del canal usa True Range (captura gaps y movimientos bruscos).
- false → el rango es simplemente High − Low.
Resumen
Valoraciones de clientes
5 | 0 % | |
4 | 100 % | |
3 | 0 % | |
2 | 0 % | |
1 | 0 % |


![Logotipo de "[Stellar Strategies] Inside Bar with Signals"](https://cdn.ctrader.com/image/webp/1d9e8bfa-3b2c-4440-bb37-5856902008a7_30683)


