📈 Indicador de Sesgo de Volatilidad – Versión Profesional (para cTrader)
Descubre una comprensión más profunda de la presión del mercado, el desequilibrio de volatilidad y la convicción direccional con el Indicador de Sesgo de Volatilidad, la versión mejorada de un enfoque clásico basado en la volatilidad originalmente inspirado en Pine Script y ahora totalmente optimizado para cTrader.
Esta herramienta ayuda a los traders a visualizar qué lado del mercado está golpeando con más fuerza — compradores o vendedores — midiendo la asimetría de la volatilidad y convirtiéndola en una señal clara y fácil de leer.
Ya sea que operes con índices, forex, materias primas o criptomonedas, este indicador sirve como un poderoso filtro de tendencia, detector de régimen y herramienta de confirmación de sesgo.
1. Qué mide el Indicador de Sesgo
El indicador evalúa el equilibrio de la volatilidad entre velas alcistas y bajistas.
Calcula un True Range normalizado y lo introduce en dos promedios adaptativos:
- Desviación Máxima → volatilidad producida durante velas alcistas
- Desviación Mínima → volatilidad producida durante velas bajistas
Luego calcula:
👉 Sesgo = DesviaciónMáx / DesviaciónMín
Esto convierte la volatilidad bruta en una lectura direccional clara:
- Sesgo > 1 → los movimientos al alza son más fuertes en promedio
- Sesgo < 1 → los movimientos a la baja son más fuertes
- Sesgo ≈ 1 → la volatilidad es simétrica y el mercado está equilibrado
En resumen:
El sesgo revela qué lado tiene la “dominancia de volatilidad”.
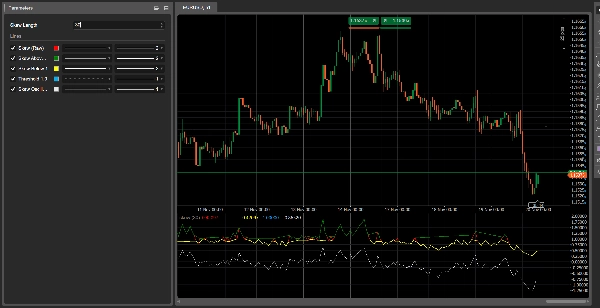
2. Entendiendo las Líneas
1. Sesgo (Bruto) – Línea roja
La proporción pura de volatilidad. Esta es la señal principal.
2. Sesgo por encima de 1 – Línea verde
Muestra la dominancia de volatilidad alcista.
3. Sesgo por debajo de 1 – Línea amarilla
Muestra la dominancia de volatilidad bajista.
4. Línea Umbral 1.0 – Línea azul punteada
Representa el equilibrio.
5. Oscilador de Sesgo (log) – Línea blanca
Representación más estable y suave:
- por encima de 0 = volatilidad alcista
- por debajo de 0 = volatilidad bajista
3. Cómo Interpretarlo
A) Regímenes del Mercado
🔹 Régimen Alcista
- Sesgo > 1
- Línea verde activa
- Oscilador por encima de cero
→ El mercado favorece posiciones largas.
🔹 Régimen Bajista
- Sesgo < 1
- Línea amarilla activa
- Oscilador por debajo de cero
→ El mercado favorece posiciones cortas.
🔹 Neutral
- Sesgo ≈ 1
→ Mercado equilibrado, adecuado para trading en rango.
4. Señales de Cambio de Régimen
Sesgo cruzando por encima de 1
→ Los compradores ganan dominancia de volatilidad
→ Transición alcista
Sesgo cruzando por debajo de 1
→ Los vendedores ganan dominancia de volatilidad
→ Transición bajista
Estos cambios a menudo ocurren antes de que la acción del precio confirme una tendencia, haciendo del Sesgo un indicador temprano poderoso.
5. Casos Prácticos de Uso
1️⃣ Filtro de Tendencia para cBots
- operar largo solo cuando SkewOsc > 0
- operar corto solo cuando SkewOsc < 0
2️⃣ Confirmación de Calidad de Tendencia
- Tendencia alcista + Sesgo > 1 = tendencia fuerte
- Tendencia alcista + Sesgo cayendo hacia 1 = tendencia debilitándose
3️⃣ Sentimiento del Mercado / Filtro de Riesgo
Particularmente efectivo en índices y pares principales de FX.
6. Resumen
- Lo que muestra: dominancia de volatilidad
- Por qué importa: los cambios de volatilidad preceden a los cambios de precio
- Cómo usarlo: como filtro, herramienta de confirmación o medidor de sentimiento
- Lo mejor: extremadamente ligero, rápido y adaptable
5 | 67 % | |
4 | 33 % | |
3 | 0 % | |
2 | 0 % | |
1 | 0 % |


