
Descripción
TrendFallowing: es un indicador técnico avanzado para la plataforma cTrader que combina múltiples enfoques analíticos en una sola solución. Desarrollado para traders que buscan confirmación de tendencia mediante la convergencia de indicadores, ofrece una vista completa del mercado con señales precisas y filtros de validación.
¡MIRA EL VIDEO INTRODUCTORIO SOBRE LA ESTRATEGIA OPERATIVA!
🎯 ESTRATEGIAS DE USO
1. Trading de Seguimiento de Tendencia
Aplicación: Identificar y seguir tendencias establecidas
Marco temporal: H4, D1 para posiciones más largas
Configuraciones: ADX > 25, Volumen por encima del promedio
Gestión de Riesgos: Stop-loss por debajo de la media móvil de 50 períodos
2. Swing Trading
Aplicación: Capturar movimientos a medio plazo
Marco temporal: H1, H4
Configuraciones: Filtro de volumen activado, confirmación por Perfil de Volumen
Objetivos: POC del Perfil de Volumen como TP
3. Trading de Rupturas
Aplicación: Entrar en rupturas de soporte/resistencia
Configuraciones: Volumen PVA para confirmar la fuerza del movimiento
Confirmación: ADX en aumento + Volumen por encima del promedio
4. Scalping (Marcos Temporales Más Cortos)
Aplicación: Operaciones rápidas con múltiples confirmaciones
Marco temporal: M1, M5
Configuraciones: Filtros estrictos de volumen y Momentum
🔧 CÓMO FUNCIONAN LOS INDICADORES
NUCLEO ADX & DI
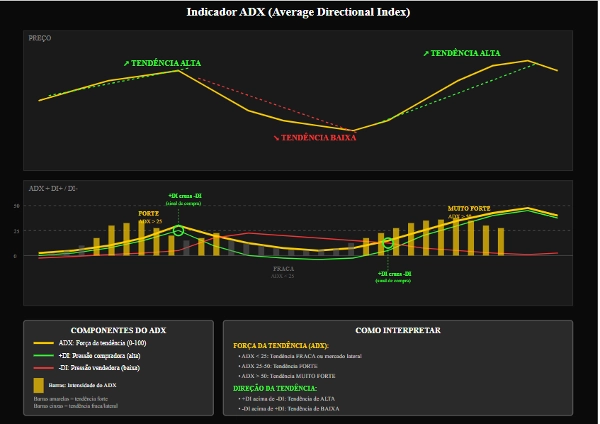
ADX (Índice Direccional Promedio)
Función: Medir la fuerza de la tendencia
Interpretación:
0-25: Tendencia débil/movimiento lateral
25-50: Tendencia fuerte
50+: Tendencia muy fuerte
Uso Práctico: Evitar operaciones cuando ADX < 20
+DI / -DI (Indicadores Direccionales)
+DI: Fuerza del comprador
-DI: Fuerza del vendedor
Señal: Cruce de +DI sobre -DI (compra) y viceversa
Pendiente ADX (Pendiente ADX)
Función: Medir la aceleración de la tendencia
Gráfico: Histograma cian
Señal: Valores positivos indican una tendencia en fortalecimiento
FILTROS DE VOLUMEN
Filtro MA de Volumen
Función: Validar señales con volumen por encima del promedio
Parámetros: Período 20, Multiplicador 1.0
Uso: Confirmación de interés institucional
Volumen PVA (Análisis de Precio y Volumen)
Colores y Significado:
Verde: Compra con volumen muy alto (>150% promedio)
Azul: Compra con volumen alto
Rojo: Venta con volumen muy alto
Rosa: Venta con volumen alto
Amarillo: Pin Bar/Agotamiento con ruptura de soporte
PERFIL DE VOLUMEN
POC (Punto de Control)
Función: Precio con el mayor volumen negociado
Uso: Objetivo natural para operaciones, soporte/resistencia dinámicos
Área de Valor
Función: Zona donde se negoció el 70% del volumen
Interpretación:
Precio arriba: Tendencia alcista
Precio abajo: Tendencia bajista
Dentro: Posible movimiento lateral
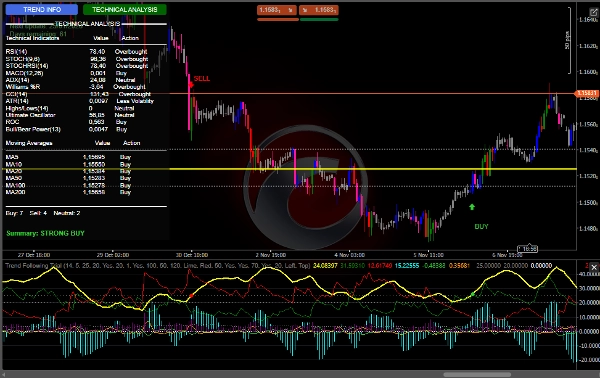
Panel de Indicadores
RSI: Sobreventa (<30) / Sobrecompra (>70)
MACD: Momentum
Williams %R: Condiciones Extremas
CCI: Identificación de Reversiones
Estocástico: Momentum a corto plazo
Oscilador Ultimate: Momentum multi-marco temporal
Medias Móviles
Conjunto completo de MAs (5, 10, 20, 50, 100, 200)
Análisis de alineación para tendencias
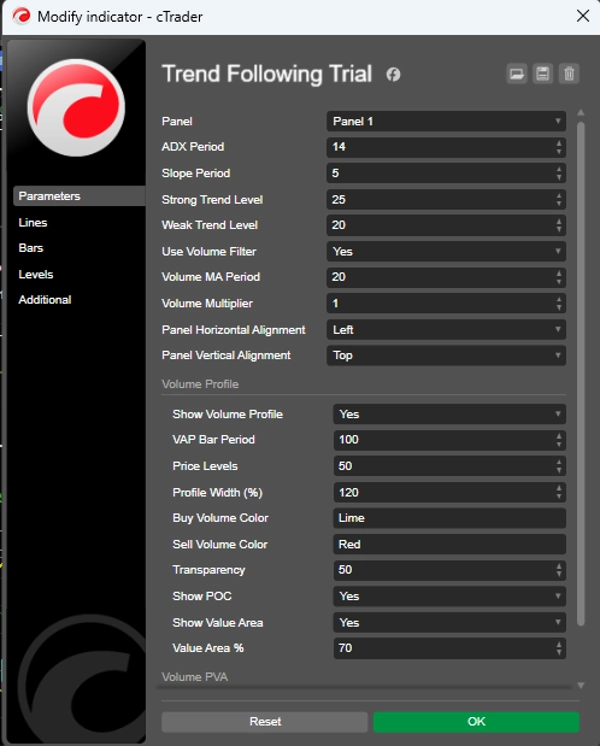
⚙️ CONFIGURACIONES RECOMENDADAS
Configuración Conservadora
Período ADX: 14
Período de Pendiente: 5
Nivel de Tendencia Fuerte: 25
Nivel de Tendencia Débil: 20
Usar Filtro de Volumen: true
Período MA de Volumen: 20
Multiplicador de Volumen: 1.2
Configuración Agresiva
Período ADX: 10
Período de Pendiente: 3
Nivel de Tendencia Fuerte: 20
Nivel de Tendencia Débil: 15
Usar Filtro de Volumen: true
Período MA de Volumen: 14
Multiplicador de Volumen: 1.0
Perfil de Volumen (Recomendado)
Mostrar Perfil de Volumen: true
Período de Barra VAP: 100
Niveles de Precio: 50
% Área de Valor: 70
Mostrar POC: true
🎨 RECURSOS VISUALES
Interfaz de Usuario
Panel Dinámico: Información en tiempo real
Botones Interactivos: Cambiar entre análisis
Colores Intuitivos: Codificación basada en funciones
Señales Gráficas
Flechas: Entradas de COMPRA/VENTA
Sonidos: Alertas audibles
Colores de Barra: Análisis PVA integrado


