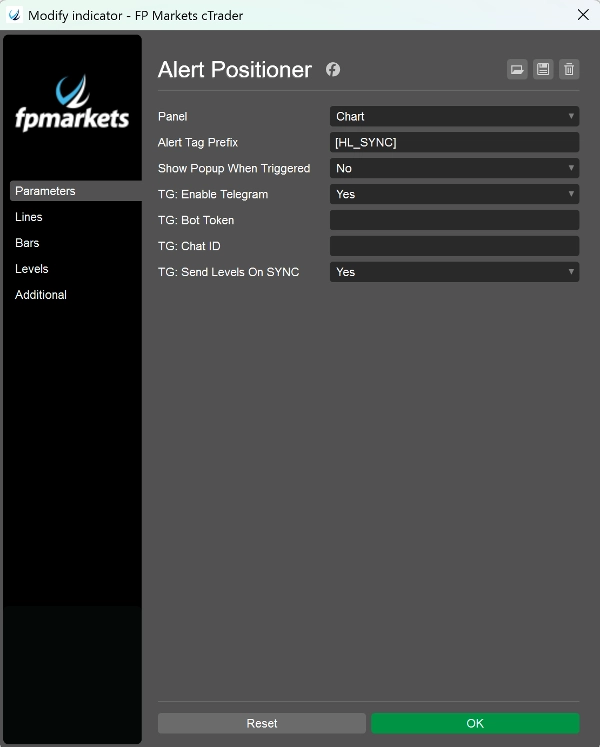
Alert Positioner
Indicador
Versión 1.1, Jan 2026
Windows, Mac
5.0
Valoraciones: 1
Descripción
HL Sync Alerts es una utilidad práctica para gráficos que convierte tus niveles horizontales en alertas de precio cTrader en vivo y siempre correctas—para que dejes de perder tiempo recreando alertas cada vez que refinas tu análisis.
Lo que obtienes
- Dibuja una línea horizontal → la alerta se crea automáticamente al mismo precio.
- Arrastra la línea → la alerta se mueve con ella (sin ediciones manuales, sin actualizaciones perdidas).
- Elimina la línea → se elimina la alerta gestionada correspondiente (tus otras alertas nunca se tocan).
- Mapeo específico por gráfico (sin conflictos): ejecuta múltiples gráficos—incluso el mismo símbolo—y cada gráfico gestiona su propio conjunto línea-alerta de forma limpia.
- Estado siempre activo (arriba a la izquierda): ve de un vistazo cuántas líneas y alertas gestionadas están activas, además del estado pendiente/sincronizado.
Comportamiento inteligente incorporado (simple, sin configuraciones)
Para mantener el flujo de trabajo sencillo, el indicador elige automáticamente Bid/Ask por nivel:
- Si el mercado está por encima de tu línea, sigue el Bid.
- Si el mercado está por debajo de tu línea, sigue el Ask.
Esto ayuda a alinear las alertas con el comportamiento realista de las cotizaciones alrededor del spread—sin obligar a los usuarios a configurar nada.
Por qué los traders compran esto (usos en el mundo real)
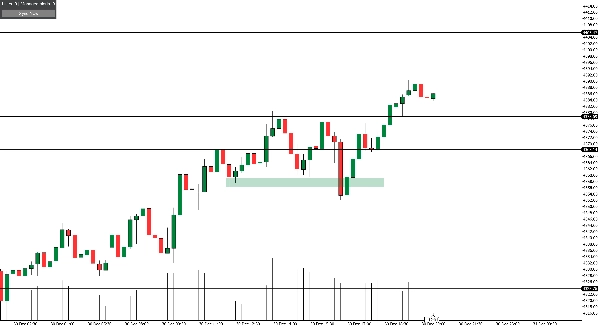
- Monitoreo de soporte/resistencia: dibuja tus niveles clave una vez y deja que las alertas sigan a medida que los ajustas.
- Marcado de zona sin volver a dibujar en otros dispositivos: dibuja una zona usando dos líneas horizontales (superior/inferior). El indicador crea alertas para ambas líneas, así que en móvil/tableta puedes usar las líneas de alerta como marcadores de zona—sin necesidad de volver a marcar.
- Planificación de ruptura + invalidación: coloca una línea disparadora de ruptura y una línea de invalidación; muévelas conforme evoluciona la estructura y las alertas permanecen precisas.
- Vigilancia de niveles para configurar y olvidar: construye un mapa limpio de niveles durante el análisis, luego confía en las alertas mientras estás alejado de la pantalla.
Notas importantes
- Esta es una herramienta de gestión de alertas, no un auto-trader ni un generador de señales.
- Las notificaciones (ventana emergente/sonido/email/push) dependen de la configuración de alertas de tu cTrader y de la configuración del dispositivo.
Resumen
Resumen de IA
Alert Positioner is a chart utility indicator designed for the cTrader platform that automates the creation and management of price alerts linked to horizontal levels. When a user draws a horizontal line on a chart, the indicator automatically generates a corresponding price alert at that level. Moving the line adjusts the alert price in real time, and deleting the line removes the associated alert, ensuring alerts remain synchronized with chart markings without manual updates.
Key features include chart-specific mapping, allowing multiple charts—even with the same symbol—to maintain independent line-to-alert sets, and an always-on status display showing active lines and alerts. The indicator intelligently selects Bid or Ask prices for alerts based on market position relative to the line, aligning alerts with realistic quote behavior without user configuration.
Common use cases involve monitoring support and resistance levels, marking zones with paired horizontal lines, planning breakout and invalidation triggers, and maintaining a set-and-forget level watch during analysis. Alert Positioner functions solely as an alert management tool and does not generate trading signals or execute trades. Notifications depend on the user’s cTrader alert settings and device configuration.
Perfil del indicador
Valoraciones de clientes
5.0
Valoraciones: 1
5 | 100 % | |
4 | 0 % | |
3 | 0 % | |
2 | 0 % | |
1 | 0 % |
Valoraciones de clientes
January 14, 2026
The first test should keep DD under 3 percent, and bad ideas get easier to avoid.
Conversación
Preguntas frecuentes
Forex
Los productos disponibles a través de cTrader Store, incluidos bots, indicadores y plugins para operar, son proporcionados por desarrolladores de terceros y están disponibles únicamente con fines informativos y de acceso técnico. cTrader Store no es un bróker, por lo que no proporciona asesoramiento de inversión, recomendaciones personales ni ninguna garantía de rentabilidad futura.


Precio
Desde 25/03/2025
181.08M
Volumen operado
2.17M
Pips ganados
21
Ventas