Descripción
El Indicador de Filtro de Kalman para cTrader 5.5+ ofrece una vista limpia y adaptativa de la tendencia del mercado al responder dinámicamente a las condiciones cambiantes de los precios.
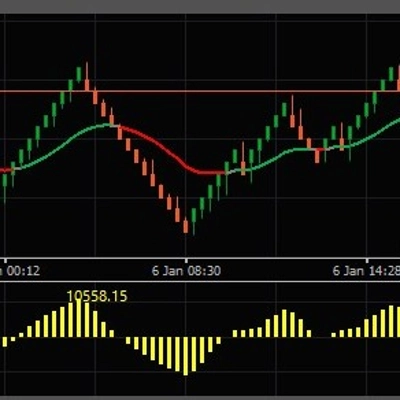
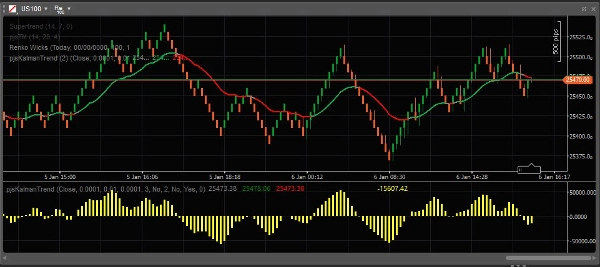
Construido sobre un algoritmo de Kalman auto-adaptativo, el indicador traza una línea de filtro de tendencia suave que reduce el ruido sin introducir un retraso excesivo. A medida que cambian las dinámicas del mercado, el filtro se ajusta automáticamente, haciéndolo adecuado tanto para fases de tendencia como de transición.
Las características clave incluyen cambios de color basados en la tendencia para una retroalimentación visual inmediata, un histograma opcional para la evaluación del impulso y el sesgo, y la capacidad de trazar ya sea en el gráfico principal o en una ventana separada para adaptarse a diferentes flujos de trabajo y estrategias.
Diseñado para un uso práctico en el trading, el indicador es ligero, eficiente (calcula al cierre de la barra), configurable y libre de pantallas molestas o interrupciones—permitiéndote concentrarte completamente en la ejecución y el análisis.
Características
- Filtro de tendencia Kalman auto-adaptativo
- Visualización de tendencia suave y con bajo ruido
- Cambios automáticos de color basados en la dirección de la tendencia
- Visualización opcional de histograma
- Trazado en gráfico o ventana separada
- Compatible con cTrader 5.5+
- Sin pantallas molestas
Este indicador es ideal para traders que buscan un filtro de tendencia limpio y adaptativo que se integre perfectamente en enfoques discrecionales o sistemáticos.
Resumen
Valoraciones de clientes
5 | 50 % | |
4 | 50 % | |
3 | 0 % | |
2 | 0 % | |
1 | 0 % |


