Description
L’Oscillateur Trendlines aide les traders à identifier les tendances et le momentum en se basant sur les distances normalisées entre le prix actuel et les lignes de tendance haussières et baissières détectées récemment.
L’indicateur présente un momentum haussier et baissier, une ligne de signal avec des croisements, et plusieurs options de lissage.
UTILISATION
L’Oscillateur Trendlines fonctionne de manière systématique :
- Identification des points pivots hauts et bas.
- Connexion des pivots pour former des lignes de tendance haussières (support) et baissières (résistance).
- Mesure de la distance (delta) entre le prix actuel et ces lignes de tendance.
- Normalisation de ces distances entre 0 et 100 pour créer des valeurs de momentum.
- Lissage des valeurs pour des signaux plus clairs.
- Génération de signaux haussiers et baissiers lorsque le momentum croise la ligne de signal.
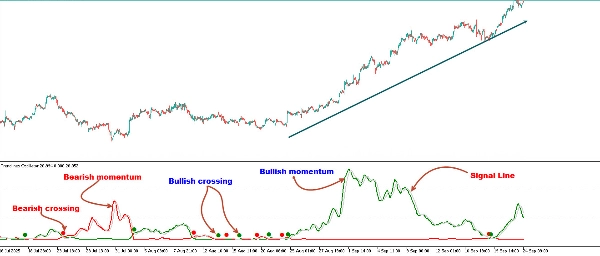
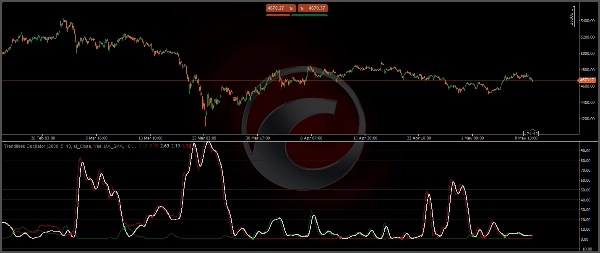
L’oscillateur affiche trois lignes clés :
Ligne de Momentum Haussier (Vert) : Mesure la force des acheteurs en calculant la distance du prix par rapport aux lignes de tendance haussières récentes servant de support.
Ligne de Momentum Baissier (Rouge) : Mesure la force des vendeurs en calculant la distance du prix par rapport aux lignes de tendance baissières récentes servant de résistance.
Ligne de Signal (Gris) : Fournit des croisements avec les lignes de momentum pour mettre en évidence des opportunités de trading potentielles.
En règle générale, lorsque la ligne de momentum haussier est au-dessus de la ligne de momentum baissier, cela indique une force acheteuse. Cela signifie que les prix actuels sont plus éloignés des lignes de support que des lignes de résistance. L’inverse est vrai pour la force vendeuse.
Pour calculer le momentum haussier, l’outil identifie d’abord les lignes de tendance haussières agissant comme support sous le prix. Ensuite, il mesure le delta entre le prix et ces lignes de tendance et normalise la lecture en valeurs de momentum affichées.
Le même processus est utilisé pour le momentum baissier, mais avec des lignes de tendance baissières agissant comme résistance au-dessus du prix.
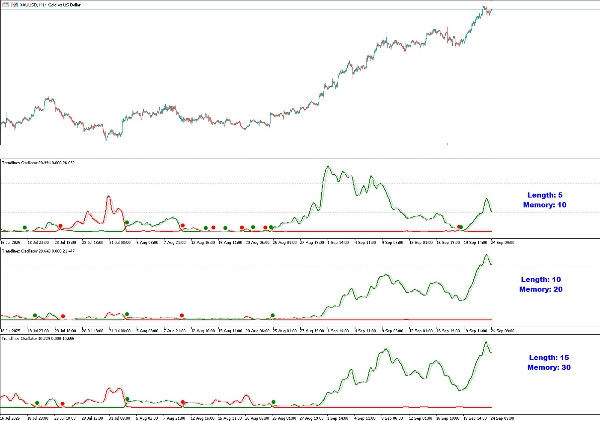
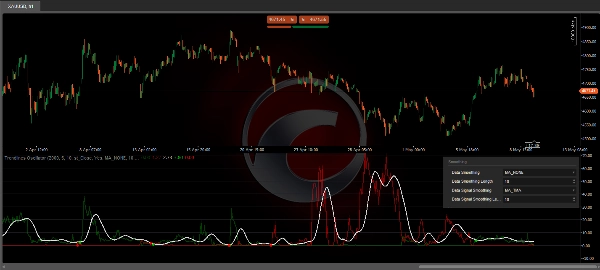
Longueur & Mémoire
- Longueur : Détermine la taille de la structure de marché utilisée pour détecter les lignes de tendance. Des valeurs plus grandes capturent des tendances plus larges, tandis que des valeurs plus petites rendent l’outil plus sensible aux mouvements à court terme.
- Mémoire : Contrôle le nombre de lignes de tendance prises en compte dans les calculs. Des valeurs de mémoire plus élevées lissent les signaux pour une analyse à long terme, tandis que des valeurs plus petites offrent des réactions plus rapides.
Modifier les valeurs de Longueur et Mémoire fera afficher à l’outil des valeurs de momentum différentes.
Les traders peuvent ajuster la longueur pour détecter des lignes de tendance plus grandes et ajuster la mémoire pour indiquer combien de lignes de tendance l’outil doit considérer.
Comme le montre le graphique ci-dessus, des valeurs plus petites rendent l’outil plus réactif, tandis que des valeurs plus grandes sont utiles pour détecter des tendances plus larges.
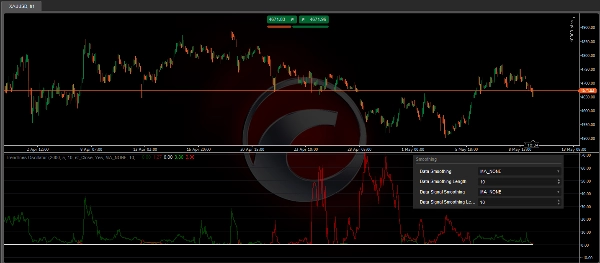
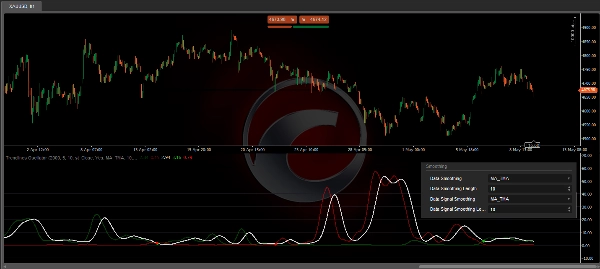
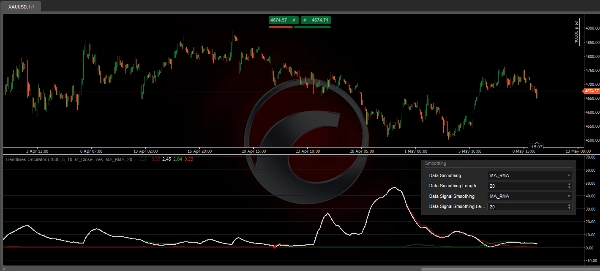
Lissage
- Lissage des données : Applique un lissage aux valeurs brutes de momentum.
- Lissage du signal : Lisse la ligne de signal elle-même pour des points de croisement plus clairs.
Par défaut, les données sont lissées par SMA, et le signal utilise une moyenne mobile triangulaire avec une longueur de 10. Les traders peuvent lisser à la fois les données et la ligne de signal.
Les traders peuvent choisir différentes méthodes, ou aucune. Quelques exemples sont montrés sur les images jointes.
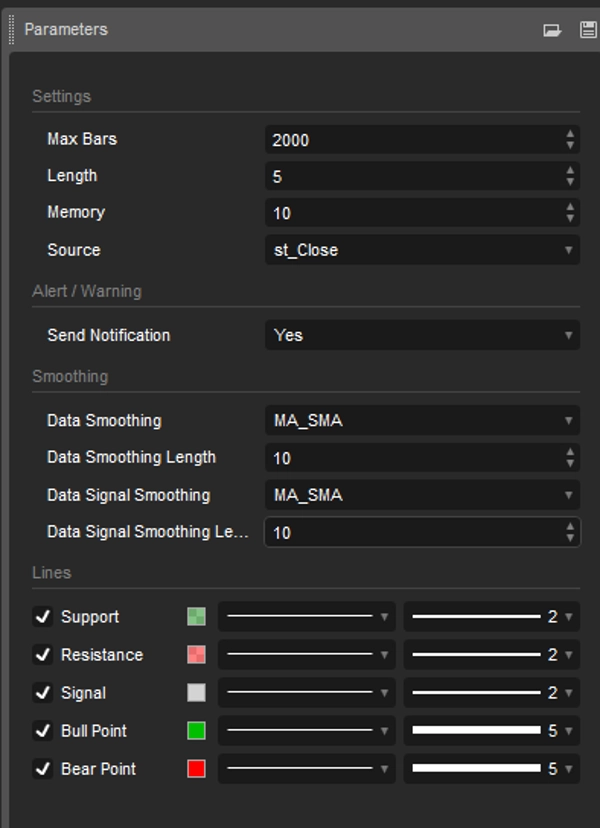
PARAMÈTRES
- Longueur : La taille de la structure de marché utilisée pour la détection des lignes de tendance.
- Mémoire : Le nombre de lignes de tendance utilisées dans les calculs.
- Source : La source des calculs est par défaut les prix de clôture.
- Lissage des données : Choisissez la méthode et la longueur de lissage
- Lissage du signal : Choisissez la méthode et la longueur de lissage
- Alerte : Alerte/Notification lors d’un croisement haussier/baissier
- Styles : Ajustez la couleur, le style, la largeur des lignes de Support/Résistance/Signal
L’indicateur de trading Oscillateur Trendlines est idéal pour les traders qui souhaitent :
- Une vision du momentum basée sur les lignes de tendance plutôt que de se fier uniquement aux moyennes mobiles ou au RSI.
- Des croisements visuels clairs pour signaler les entrées et sorties potentielles.
- Un lissage personnalisable pour s’adapter à différents styles de trading.
- Un outil qui met en évidence la domination des acheteurs vs vendeurs en temps réel.
- En combinant l’analyse structurelle du marché avec les calculs de momentum, cet outil offre un avantage unique pour repérer à la fois la continuation et les opportunités de retournement de tendance.
Résumé
Users can customize the indicator’s sensitivity and responsiveness by adjusting the Length (market structure size for trendline detection) and Memory (number of trendlines considered). The tool also offers data and signal smoothing options using various methods, including SMA and triangular moving averages, to provide clearer signals. The Trendlines Oscillator supports alerts for bullish and bearish crossovers and allows customization of line styles and colors. It provides a structural market analysis combined with momentum calculations to help traders assess buyer versus seller dominance and identify trend continuation or reversal opportunities.


