

Descripción
# 🚀 Índice de Deslizamiento Cinético (KSI) – Herramienta Avanzada de Análisis de Presión de Mercado y Liquidez
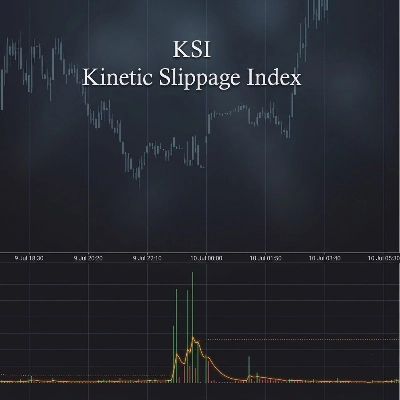
Descubre conocimientos más profundos del mercado con el **Índice de Deslizamiento Cinético (KSI)** — un potente indicador de trading diseñado para identificar movimientos inusuales de precios, desequilibrios de volumen y posibles eventos de liquidez antes de que sean evidentes en el gráfico.
Creado para traders que analizan **estructura del mercado, comportamiento del volumen, volatilidad y actividad institucional**, el KSI combina la expansión del rango y la dinámica del volumen para medir condiciones anormales del mercado.
## 🔥 Características Clave
✅ **Cálculo del Índice de Deslizamiento Cinético**
* Mide la relación entre el movimiento del precio y el volumen negociado.
* Detecta situaciones donde el precio se mueve de manera desproporcionada en comparación con el comportamiento normal del volumen.
* Ayuda a identificar posibles tensiones de liquidez, actividad agresiva del mercado y momentum inusual.
✅ **Detección Adaptativa de Picos**
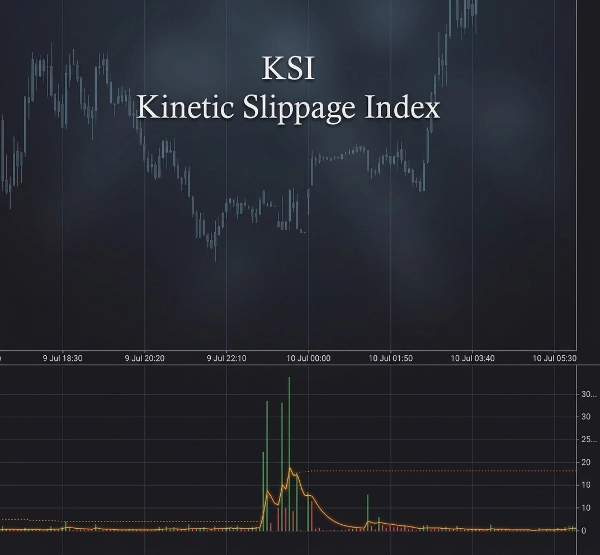
* Calcula automáticamente niveles dinámicos de picos basados en el comportamiento reciente del mercado.
* Utiliza análisis de desviación estadística para resaltar eventos extremos del mercado.
* Se adapta a condiciones cambiantes de volatilidad sin requerir ajustes manuales constantes.
✅ **Alertas de Picos en Tiempo Real 🚨**
* Recibe notificaciones cuando ocurre una divergencia anormal de volumen/rango.
* Ayuda a los traders a identificar rápidamente condiciones potenciales de ruptura, capturas de liquidez o presión repentina del mercado.
✅ **Análisis de Volumen y Flujo 📊**
* Rastrea el volumen actual comparado con su promedio EMA.
* Destaca cuando la actividad de trading es inusualmente alta.
* Incluye análisis delta acumulativo para visualizar la presión de compra y venta.
✅ **Confirmación de Línea de Señal 📈**
* El cálculo suave de la señal ayuda a identificar cambios en el momentum del KSI.
* La visualización con histograma verde/rojo facilita la lectura de cambios en la presión del mercado.
## 🕒 Inteligencia de Sesión de Trading
KSI incluye seguimiento automático de sesiones de mercado:
🌏 Sesión de Asia
🇬🇧 Sesión de Londres
🇺🇸 Nueva York AM
☕ Almuerzo en Nueva York
🌆 Nueva York PM
La visualización integrada de killzone ayuda a los traders a entender cuándo la liquidez y la volatilidad suelen ser más altas.
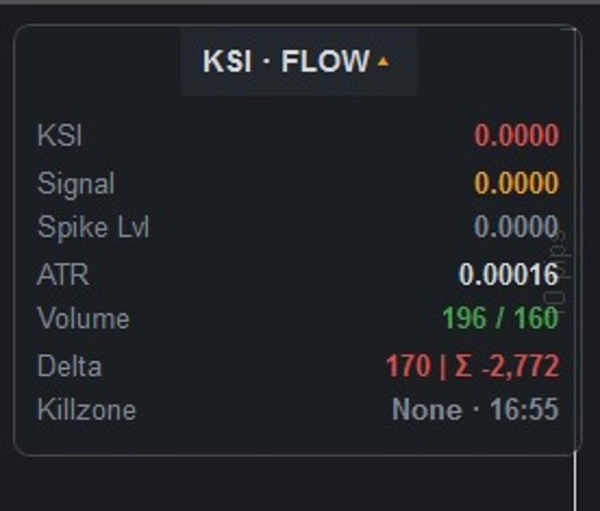
## 📌 Panel de Información Profesional
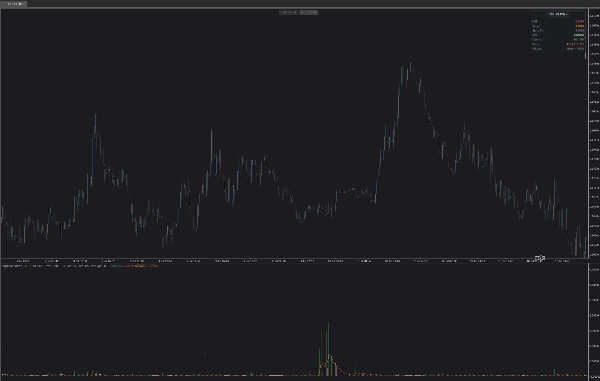
El panel integrado ofrece una vista clara directamente en tu gráfico:
📍 Valor actual del KSI
📍 Nivel de señal
📍 Umbral adaptativo de picos
📍 Lectura de volatilidad ATR
📍 Volumen actual vs volumen promedio
📍 Delta y delta acumulativo
📍 Sesión de trading activa / killzone
El panel puede ser:
* ✅ Posicionado en cualquier esquina del gráfico
* ✅ Colapsado o expandido
* ✅ Ajustado con opacidad personalizada
## ⚙️ Configuraciones Personalizables
Ajusta finamente el KSI para cualquier estilo de trading:
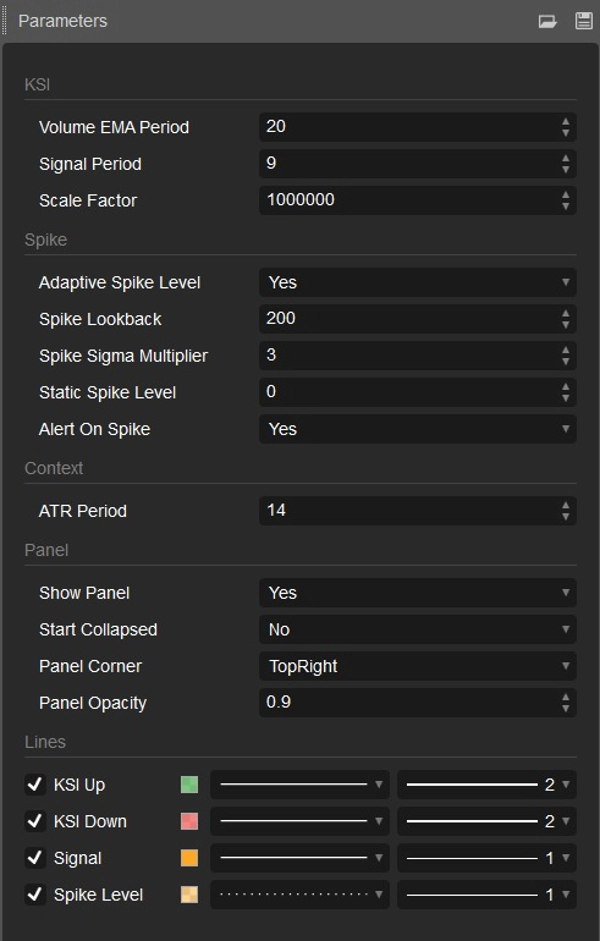
🔧 Periodo EMA de Volumen
🔧 Periodo de Señal
🔧 Factor de Escala
🔧 Detección de picos adaptativa o fija
🔧 Periodo de retroceso para picos
🔧 Multiplicador de sensibilidad de picos
🔧 Periodo ATR
🔧 Configuraciones de apariencia del panel
## 🎯 Diseñado Para
✔ Traders de Forex
✔ Traders de Futuros
✔ Traders de Cripto
✔ Scalpers
✔ Traders diarios
✔ Analistas de estructura de mercado
✔ Traders que buscan confirmación basada en volumen
## 💡 Cómo Usan los Traders el KSI
El KSI puede ayudar a identificar:
⚡ Actividad inusual del mercado
⚡ Presión potencial de ruptura
⚡ Divergencia volumen-precio
⚡ Eventos de liquidez
⚡ Cambios en el momentum
⚡ Oportunidades de trading en alta volatilidad
Combina el KSI con tu estrategia existente para obtener una visión más clara de **cuándo el mercado se mueve normalmente — y cuándo está ocurriendo algo inusual.**
📈 Opera con inteligencia. Comprende la presión del mercado. Detecta actividad oculta con el Índice de Deslizamiento Cinético.
Resumen
The indicator includes volume and flow analysis by comparing current volume to its exponential moving average (EMA) and incorporates cumulative delta analysis to visualize buying and selling pressure. A smooth signal line and histogram help confirm changes in KSI momentum, making shifts in market pressure easier to interpret.
KSI tracks major trading sessions—Asia, London, and New York (AM, Lunch, PM)—highlighting periods of higher liquidity and volatility. A professional information panel displays key metrics such as current KSI value, signal level, adaptive spike threshold, ATR volatility, volume comparisons, delta values, and active trading sessions. This panel is customizable in position, size, and opacity.
Settings allow fine-tuning of volume EMA period, signal period, scale factor, spike detection parameters, ATR period, and panel appearance. KSI is suitable for forex, futures, and crypto traders, including scalpers, day traders, and market structure analysts seeking volume-based confirmation and insights into unusual market activity, breakout pressure, liquidity events, and momentum changes.
Conversación
Valoraciones de clientes
5 | 0 % | |
4 | 100 % | |
3 | 0 % | |
2 | 0 % | |
1 | 0 % |
Preguntas frecuentes
Más de este autor


















Precio