present
Đăng ký và nhận ưu đãi $50 cho lần mua đầu tiên
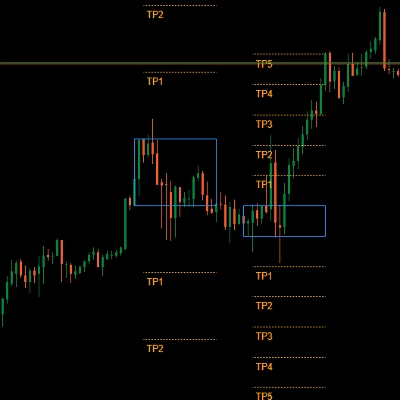
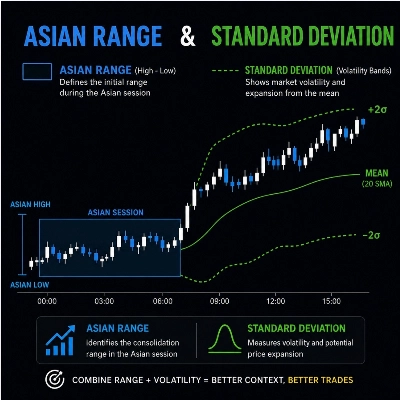
Trading product for AsianRange indikator Chỉ báo Key Levels Market Structure, image 1
AsianRange indikator
Chỉ báo
Phiên bản 1.0, Jul 2026
Windows, Mac
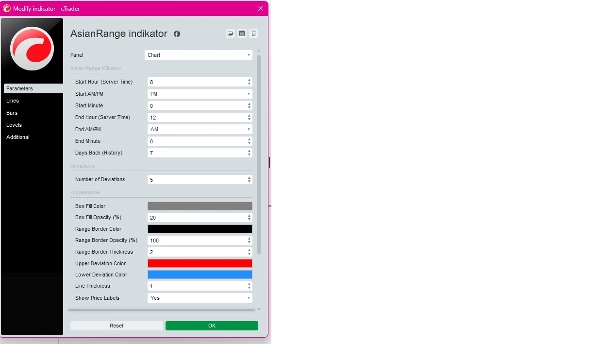
Trading product for AsianRange indikator Chỉ báo Key Levels Market Structure, image 2
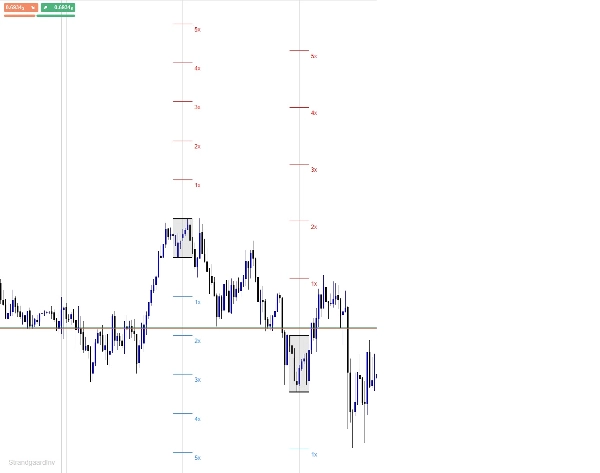
Trading product for AsianRange indikator Chỉ báo Key Levels Market Structure, image 3
Kể từ 19/09/2025

Mô tả

WHAT DOES IT DO?

--------------------------------------------------------

The indicator draws the range from 8PM to 12AM

for each day for a rolling number of days back ("Days Back"),

including today (live).


For each day, it draws:

- A filled box marking the range itself (high/low)

- A horizontal line at the top of the range

- A horizontal line at the bottom of the range

- Standard deviation lines (1x to 5x, number adjustable)

above and below the range, limited to the same time width

as the range itself (not projected to the right)


Everything for a given day is automatically cleared away again when the day

falls outside your chosen "Days Back" window.


--------------------------------------------------------

IMPORTANT: TIME ZONE / DST

----------------------------------------------------------------

The start and end time of the range (default 8 PM - 12 AM)

is entered in YOUR BROKER'S SERVER TIME - not automatically in EST.


The indicator does NOT convert between EST/EDT and your

broker's server time. This means:


1. You have to find out what 20:00-00:00 EST

corresponds to on your broker's server clock (e.g. check a known

news time against your chart).


2. When the USA switches to/from daylight saving time (DST), or if

your broker's server does not follow DST,

the difference changes - then you have to update the Start/End

Hour parameters in the indicator yourself.


Standard Range window: 8:00 PM - 12:00 AM EST.


-----------------------------------------------------

PARAMETERS

----------------------------------------------------------

8pm-12am Range Window:

Start Hour / Start AM-PM / Start Minute - start of the range (server time)

End Hour / End AM-PM / End Minute - end of the range (server time)

Days Back (History) - how many days back

are shown (0 = today only)

Deviations:

Number of Deviations - number of SD levels (1-10),

default 5

Appearance:

Box Fill Color / Box Fill Opacity (%) - color and transparency

for the range box itself

Range Border Color / Range Border Opacity - color and transparency

/ Range Border Thickness for the top/bottom lines

Upper Deviation Color - color for SD lines above the range

Lower Deviation Color - color for SD lines below the range

Line Thickness - thickness of SD lines

Show Price Labels - show/hide "1x", "2x" etc.

next to the SD lines

----------------------------------------------------------------------

KNOWN PITCH

------------------------------------------------------

If the top/bottom lines (Range Border Color) are set to a color that matches your chart background (e.g. white line on white background), they will look like they are "not being drawn" - they just lie there invisibly. Default is set to black, which suits a light/white chart theme. Change to a lighter color if you are using a dark theme.


--------------------------------------------------------

INSTALLATION

---------------------------------------------------------

1. Open cTrader -> Automate tab.

2. Create a new Indicator (or open an existing one).

3. Replace the code with the contents of the.cs file

4. Build.

5. Add the indicator to your chart via "Add algorithm".


--------------------------------------------------------


Tóm tắt

Hồ sơ chỉ báo
Danh mục chỉ báo
Cấu trúc thị trường (SMC)
Loại đầu ra
Hình ảnh trực quan
Yêu cầu dữ liệu
Chỉ dữ liệu nến
Tín hiệu được hỗ trợ
Khoảng giá mở phiên

Thảo luận

Đánh giá của khách hàng

0.0
Đánh giá: 0
Đánh giá của khách hàng
Sản phẩm này chưa có đánh giá nào. Bạn đã dùng thử chưa? Hãy là người đầu tiên chia sẻ với mọi người!

Câu hỏi thường gặp

Key Levels
Market Structure
Các sản phẩm có sẵn trên cTrader Store, bao gồm bot giao dịch, chỉ báo và plugin, được cung cấp bởi các nhà phát triển bên thứ ba và chỉ nhằm mục đích cung cấp thông tin và tiếp cận kỹ thuật. cTrader Store không phải là nhà môi giới và không cung cấp lời khuyên đầu tư, khuyến nghị cá nhân hay bất kỳ đảm bảo nào về hiệu suất trong tương lai.

Bạn cũng có thể thích

Chỉ báo
Breakout
FlexSR auto‑detects pivot highs/lows to plot dynamic support & resistance lines Features customizable styling and option
Chỉ báo
Forex
cTrader Auto Support & Resistance detects key levels with Fibonacci analysis and sends real-time trading alerts.
Logo "heatmap kopie"
Phổ biến
4.2
(4)
$19
/
$29
Chỉ báo
AI
SMC
+13
Dynamic Liquidity Depth exposes hidden volume
Chỉ báo
ATR
BOS
+5
Opening ranges, dynamic trend channels, and multi-scale breakout/retest analysis for clear intraday chart decisions.
Chỉ báo
Pin Bar
Inside Bar
+2
Advanced candlestick pattern recognition with structural quality scoring, alerts and adaptive chart visuals.
Chỉ báo
ADX
ATR
+2
GOLD SENTINEL v1.0 - A CANDLE-COLORING INDICATOR FOR GOLD.
Chỉ báo
ATR
Wedge
+2
Strong Supertrend Turn Market Movement into a Clear Map Market analysis
Chỉ báo
SMC
Forex
+5
The only cTrader FVG indicator with Breakaway Gap detection, mitigation tracking, and full multi-asset compatibility.
Chỉ báo
Forex
Crypto
+4
Pro Heikin Ashi Visual Overlay – Clean Trend Visualization
Logo "ORB v1"
Phổ biến
5.0
(3)
$19
Chỉ báo
Breakout
Opening Range Breakout (ORB) - Visual Edition
Chỉ báo
ATR
RSI
+7
Identify bullish and bearish Order Blocks to spot key support/resistance levels and potential trend reversals! 📈🔄
Chỉ báo
ATR
The Tenkan-ATR Indicator is a powerful and innovative indicator for Traders. SALE OFF!!!
Chỉ báo
AI
Forex
+5
Whale Hunting Indicator
Chỉ báo
BOS
EMA
+5
VWAP Bands indicator with 3 standard deviation levels, buy/sell zones, and a draggable ON/OFF button to toggle the entir
Chỉ báo
ATR
Channel
+1
Bollinger Bands Advanced Squeeze & Breakout System, Real-Time On-Chart Dashboard, Auto-Squeeze Detector, Dual-Band Cloud
Chỉ báo
Prop
Forex
+4
A precision-crafted indicator that compares current volume to its historical average for the same time of day.
Chỉ báo
Prop
Forex
+5
Tracks NY, London, Tokyo, Sydney sessions with custom visuals, and a real-time expanding range box and breakout High/Low
Chỉ báo
EMA
RSI
+5
MACD Colour Histogram with 11 Moving Average Types, Multi-timeframe confirmation and Sound Signal Alert.

Giá

Kể từ 19/09/2025