


Descripción
Qué hace
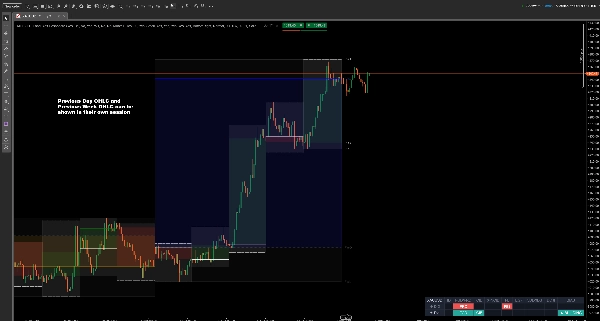
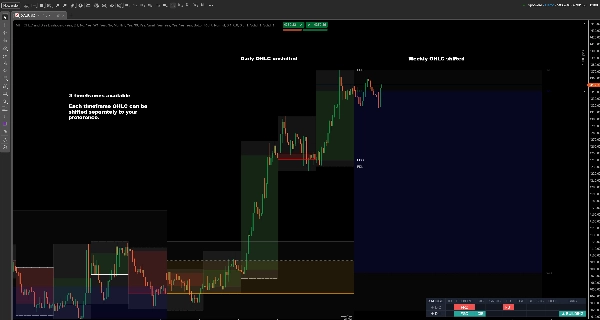
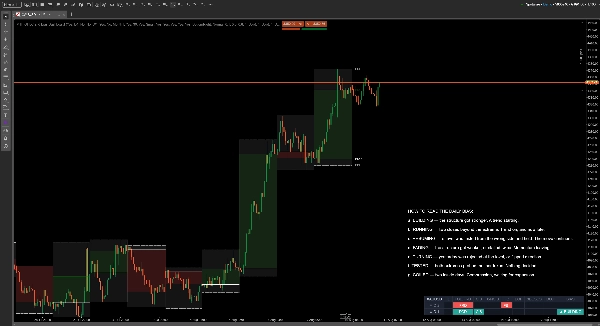
MULTI-TIMEFRAME OHLC y PANEL DE SESGO es un indicador de acción de precio multitemporal para cTrader. Dibuja los niveles OHLC del día anterior, la semana anterior y el mes anterior — apertura, máximo, mínimo y cierre — en tu gráfico, y añade un panel que interpreta lo que el precio realmente hizo en esos niveles durante los últimos dos días completados.
El máximo y mínimo del día anterior (PDH y PDL), la apertura diaria, el máximo y mínimo semanal: estos son los niveles de soporte y resistencia de marcos temporales superiores con los que la mayoría de los traders intradía y de swing ya trabajan. Lo que usualmente hacen a simple vista cada mañana es compararlos — ¿cerró ayer por encima del día anterior? ¿El precio superó el máximo del día anterior y falló? ¿Se está construyendo el movimiento o se está quedando sin espacio? Este indicador responde esas preguntas en el gráfico, en una sola fila.
Niveles OHLC multitemporales
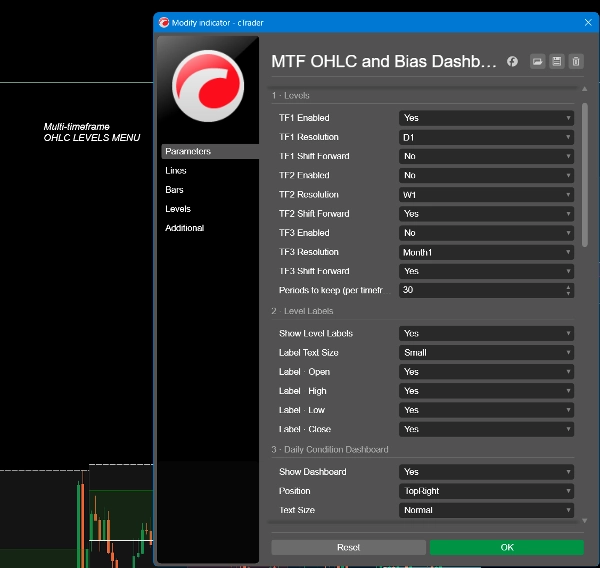
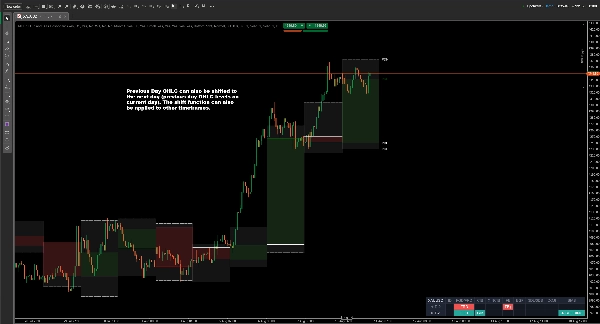
Hasta tres marcos temporales a la vez — diario, semanal, mensual, o cualquier resolución que elijas. Cada uno dibuja su apertura, máximo, mínimo y cierre, con un cuerpo sombreado opcional y una banda de máximo a mínimo. Los niveles pueden desplazarse hacia adelante para que la referencia del período actual esté delante del precio en lugar de detrás, y puedes mantener hasta 70 períodos históricos en el gráfico.
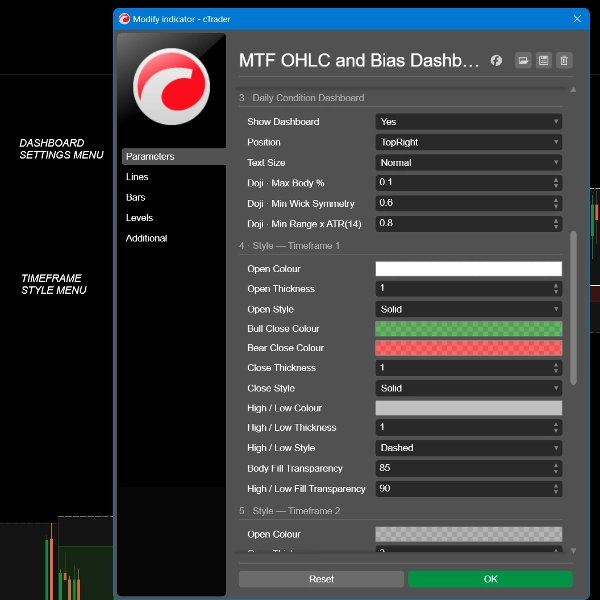
Cada línea tiene su propio color, grosor y estilo, para que un nivel de soporte semanal nunca se confunda con uno diario.
El panel de condición diaria
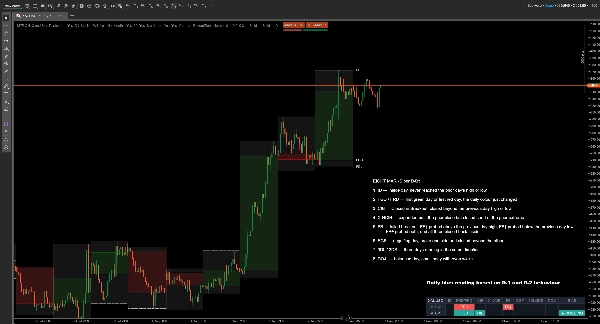
El panel evalúa las últimas dos velas diarias completadas — D-1 (ayer) y D-2 (el día anterior) — cada una en comparación con el día que la precedió.
Nueve marcas por día:
- ID — día interno, nunca alcanzó el máximo o mínimo del día anterior
- FGD / FRD — primer día verde o primer día rojo, el color diario acaba de cambiar (Verde es día alcista y Rojo es día bajista)
- CIB — Cerró en ruptura, cerró más allá del máximo o mínimo del día anterior
- X-NCIB — se expandió más allá del cierre anterior pero cerró antes del extremo previo (Expand Not Closed In Breakout = X-NCIB)
- FB — ruptura fallida: FB↑ sondeo por encima del máximo del día anterior, FB↓ sondeo por debajo del mínimo del día anterior, FB± sondeo ambos, y los tres cerraron de nuevo dentro
- EGF — día envolvente, rompió un lado y cerró más allá del otro
- 3DL / 3DS — tres días consecutivos en la misma dirección (3 Días de Largo = 3DL / 3 Días de Corto = 3DS)
- DOJI — día equilibrado, cuerpo pequeño con mechas iguales
- BIAS — la lectura, explicada abajo
Cómo leer el sesgo diario
El sesgo es la parte que te ahorra trabajo. Cada día se reduce a un solo estado, y el sesgo proviene del movimiento entre D-2 y D-1 — no solo de ayer. La misma marca significa cosas diferentes dependiendo de lo que la precedió, y eso es exactamente lo que un panel de un solo día no puede decirte.
- CONSTRUYENDO — la estructura se fortaleció. Un inicio de tendencia.
- EN MARCHA — dos cierres más allá del extremo. Tendencia activa, y ahora tardía.
- REANUDANDO — se probó un nivel desde el lado equivocado y se mantuvo. El movimiento continúa.
- DESVANECIÉNDOSE — la estructura se debilitó, o se estancó dos veces. El impulso se va.
- GIRANDO — ayer fue rechazado en el nivel, o cambió de dirección.
- PROBADO — se sondearon ambos extremos, ninguno fue tomado. Nada decidido.
- ENROLLADO — dos días internos. Compresión, esperando expansión.
Una flecha y color indican la dirección: verde hacia arriba para alcista, rojo hacia abajo para bajista, gris neutro cuando no hay dirección que dar.
Ambas filas de detalle permanecen visibles sobre el sesgo, para que siempre puedas ver por qué se lee de esa manera en lugar de confiar en una caja negra.
Uso típico
Abre el gráfico por la mañana, lee el sesgo y sabe antes de que comience la sesión si buscas continuación, un desvanecimiento o un rango. Luego opera tus propias configuraciones contra los niveles dibujados — el máximo y mínimo del día anterior, la apertura diaria, los extremos semanales.
Es adecuado para trabajo de rango de apertura, trading de rupturas fallidas y estrategias de continuación día a día. Útil en forex, índices, metales y criptomonedas.
Configuraciones
- Tres ranuras de marco temporal independientes, cada una con su propia resolución, conmutador de desplazamiento hacia adelante y controles completos de color, grosor y estilo
- Número de períodos históricos a mantener, hasta 70
- Etiquetas de nivel activadas o desactivadas, por tipo de línea, con tamaño de texto ajustable
- Panel activado o desactivado, cinco posiciones en pantalla, cuatro tamaños de texto
- Sensibilidad Doji: porcentaje máximo de cuerpo, simetría mínima de mechas, rango mínimo relativo al promedio de 14 días
******************************************************
Para quién es
Traders intradía y de swing que ya trabajan con niveles del día anterior y la semana anterior. Se asume que sabes qué es un máximo del día anterior y por qué importa. Si esos niveles no forman parte de cómo operas, esto no te enseñará a usarlos.
Qué no hace
Ser claro sobre esto ahora nos ahorra tiempo a ambos después:
- No da señales de compra o venta, ni precios de entrada o salida
- No coloca órdenes ni puede tocar tu cuenta — el indicador funciona sin derechos de acceso
- No tiene alertas ni notificaciones
- No predice nada. Cada marca describe velas que ya cerraron
- No repinta. El panel lee solo velas diarias completadas, por lo que una lectura nunca cambia después del hecho
- No es una estrategia. El sesgo describe estructura; no recomienda una operación
********************************************************
Cosas que vale la pena saber
El panel necesita al menos cuatro velas diarias completadas, por lo que un símbolo recién listado mostrará guiones hasta que tenga suficiente historial.
Las velas diarias comienzan a la hora del servidor de tu broker. Dos brokers en el mismo instrumento pueden cortar el día en horas diferentes, lo que significa que el mismo símbolo puede leerse legítimamente diferente en dos plataformas. Eso es una propiedad de los datos, no un fallo del indicador.
Por encima del marco temporal diario, el panel no puede leer datos diarios y muestra una advertencia TF > D. Los niveles aún se dibujan.
El trading implica riesgo. El rendimiento pasado no garantiza resultados futuros.
Resumen
A central feature is the two-day price action bias dashboard, which analyzes the last two completed daily candles relative to their preceding days. It categorizes daily price behavior into nine distinct patterns (e.g., inside day, first green/red day, failed breakout, engulfing day) and summarizes the overall bias into states such as building, running, fading, or turning. Directional bias is indicated with colored arrows (green for bullish, red for bearish, grey for neutral), helping traders quickly assess market structure without guesswork.
Designed for intraday and swing traders familiar with previous day and week levels, the indicator does not provide trade signals, alerts, or order execution. It is suitable for forex, indices, metals, and cryptocurrencies, aiding strategies like opening-range, failed-breakout, and continuation trading by clearly marking key levels and daily price action context.
Conversación
Valoraciones de clientes
Preguntas frecuentes
Más de este autor




















Precio