present
Regístrese y obtenga 50 $ de descuento en su primera compra
Trading product for TradeLens Indicador Chart UI Tools Key Levels, image 1
TradeLens
Indicador
Versión 1.3, Sep 2026
Windows, Mac
4.5
Valoraciones: 4
Trading product for TradeLens Indicador Chart UI Tools Key Levels, image 2
Trading product for TradeLens Indicador Chart UI Tools Key Levels, image 3
Trading product for TradeLens Indicador Chart UI Tools Key Levels, image 4
Trading product for TradeLens Indicador Chart UI Tools Key Levels, image 5
Trading product for TradeLens Indicador Chart UI Tools Key Levels, image 6
Trading product for TradeLens Indicador Chart UI Tools Key Levels, image 7
Trading product for TradeLens Indicador Chart UI Tools Key Levels, image 8
Trading product for TradeLens Indicador Chart UI Tools Key Levels, image 9
Trading product for TradeLens Indicador Chart UI Tools Key Levels, image 10
Trading product for TradeLens Indicador Chart UI Tools Key Levels, image 11
Desde 09/02/2026
29
Ventas
179
Instalaciones gratis

Descripción

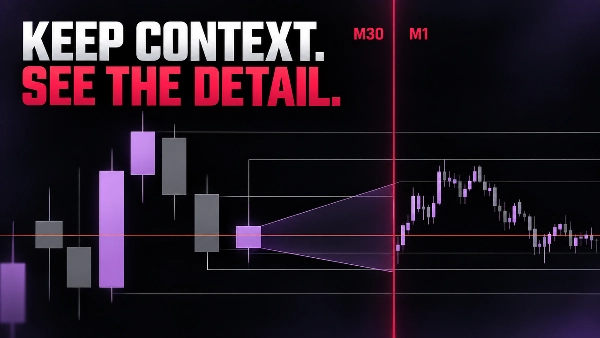
TRADELENS - MANTÉN EL CONTEXTO. VE EL DETALLE.

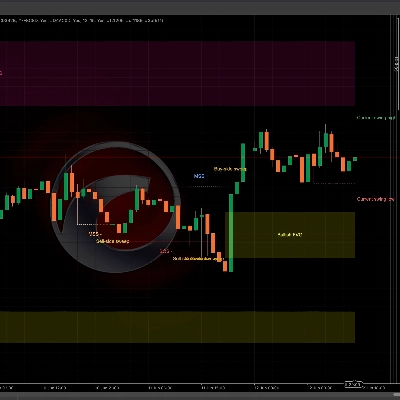
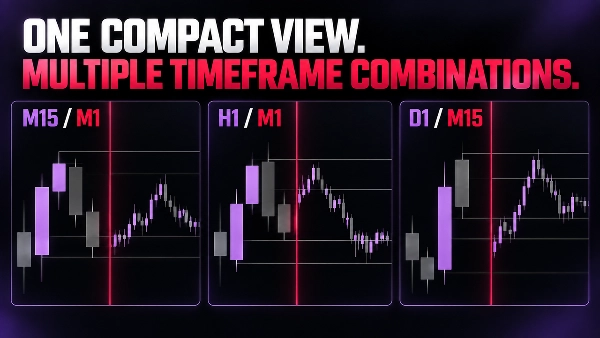
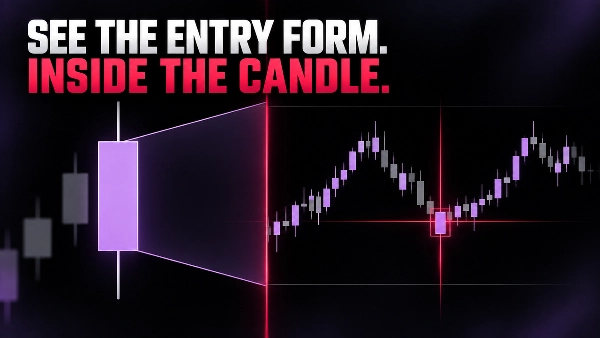
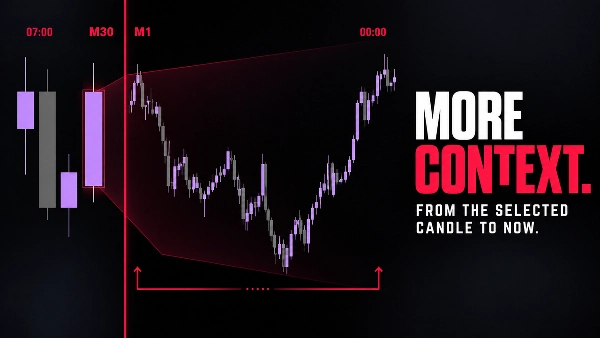
TradeLens coloca una vista compacta de velas de un marco temporal inferior directamente dentro de tu gráfico actual. El gráfico original sigue siendo tu contexto de marco temporal superior; el panel de detalles muestra cómo se desarrolla el precio dentro de la vela de contexto seleccionada.

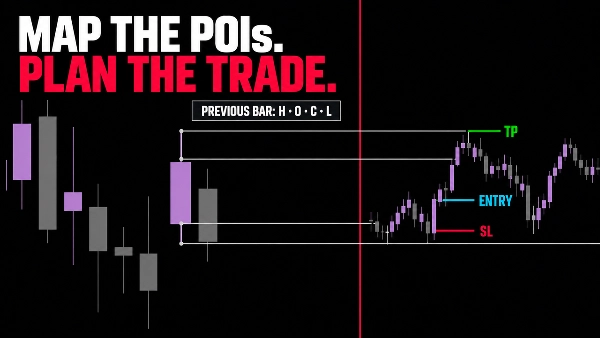
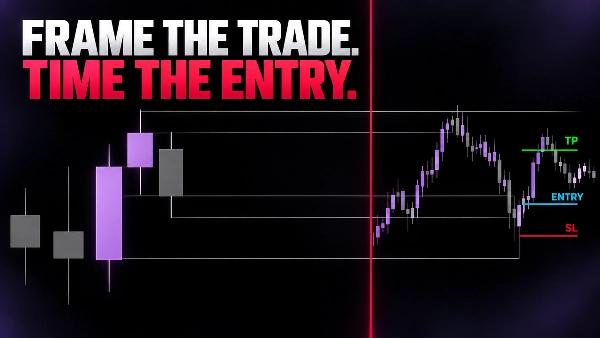
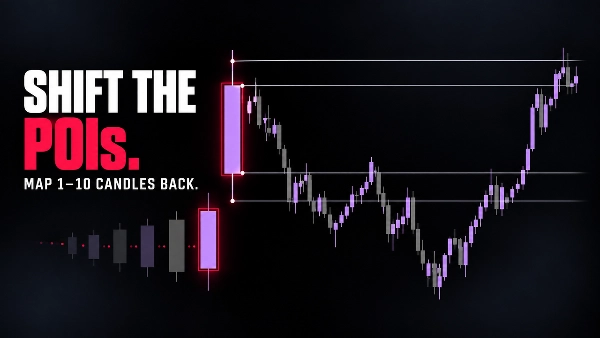
Usa por defecto la vela que se está formando actualmente, o retrocede para inspeccionar una vela de contexto anterior. Puedes enmarcar la configuración activa con POI opcionales (rayos) en el Alto, Bajo, Apertura y Cierre de la barra cerrada anterior, y luego estudiar el movimiento de marco temporal inferior sin salir del gráfico.

LO QUE TRADELENS TE AYUDA A VER

  • Estructura de marco temporal superior y detalle de marco temporal inferior en la misma ventana.
  • La progresión de la vela de contexto actual a una escala más fina.
  • Puntos de interés OHLC de la barra anterior a lo largo del gráfico.
  • Combinaciones compactas como M15/M1, M30/M1, H1/M1, D1/M15 y D1/M30.
  • Una forma más limpia de refinar el momento de entrada mientras se preserva el contexto.
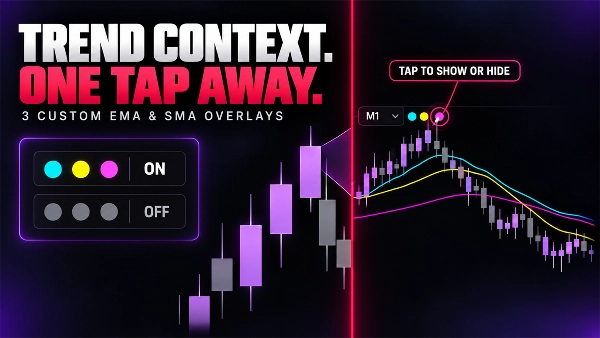
  • Agrega hasta tres superposiciones personalizables de EMA o SMA.
  • Muestra u oculta cada promedio instantáneamente con controles de un toque.
  • Ve la dirección de la tendencia directamente dentro de la vista de marco temporal inferior.

CONTROLES SIMPLES Y VISUALES

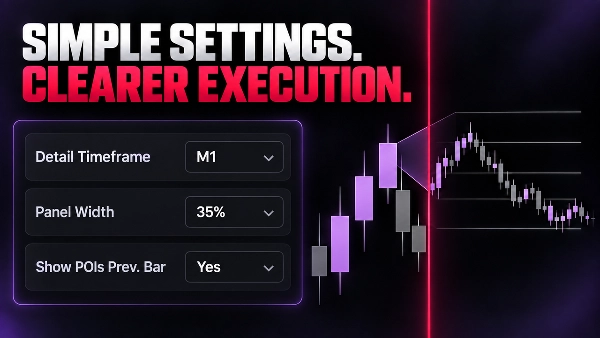
  • Marco temporal de detalle y desplazamiento de la vela de contexto.
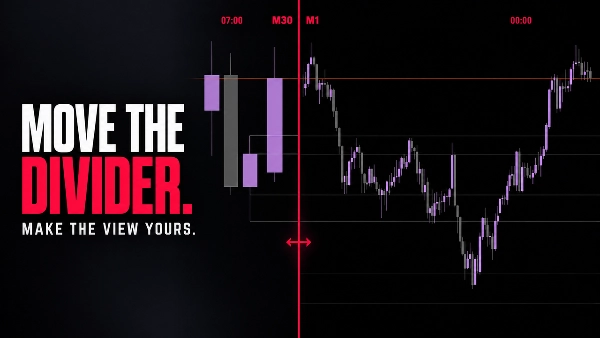
  • Ancho del panel de detalles, fondo y opacidad.
  • Colores para alcista, bajista, separador y etiquetas.
  • POI opcionales de la barra anterior con color y grosor configurables.

El marco temporal de detalle debe ser menor que el marco temporal del gráfico. Si la combinación es inválida, TradeLens oculta su visualización y muestra un banner de configuración claro.

TradeLens es una herramienta de análisis visual. No coloca, modifica ni gestiona órdenes. Los ejemplos mostrados en la galería ilustran un flujo de trabajo de lectura de gráficos y no son recomendaciones de trading ni garantías de rendimiento.


Resumen

Resumen de IA
TradeLens is a chart visualization tool designed to integrate two timeframes within a single trading chart. It embeds a compact lower-timeframe candle view inside the current higher-timeframe chart, allowing traders to observe detailed price action within the context of a broader market structure. Users can analyze the progression of the current or previous context candles at a finer scale without switching charts.

Key features include optional points of interest (POIs) marking the previous bar’s Open, High, Low, and Close levels, customizable visual settings such as detail panel size, background opacity, and color schemes for bullish, bearish, and separator elements. TradeLens supports common timeframe combinations like M15/M1, M30/M1, H1/M1, D1/M15, and D1/M30, ensuring the detail timeframe is always smaller than the context timeframe.

This tool facilitates refined entry timing by preserving higher-timeframe context while providing granular lower-timeframe insights. It is a visual analysis indicator and does not execute or manage trades. TradeLens is tagged under market structure and chart UI tools, supporting analysis related to key levels, liquidity sweeps, market structure changes, and inducements.
Perfil del indicador
Categoría del indicador
Estructura del mercado (SMC)
Tipo de resultado
Visualización
Requisitos de datos
Únicamente barras

Conversación

Valoraciones de clientes

4.5
Valoraciones: 4
5
50 %
4
50 %
3
0 %
2
0 %
1
0 %
Valoraciones de clientes
October 24, 2026
smaller candles inside the larger one are an elegant way to retain the path within the wider move, with optional previous OHLC giving the comparison useful reference points instead of adding entry signals.
October 8, 2026
M1 candles inside an H1 candle keep the little moves and the bigger picture together. Previous OHLC can be added when needed. A handy comparison overlay, with the detail period required to stay smaller than the context period.
October 4, 2026
TradeLens displayed an embedded M1 candle view on EURUSD H1 and XAUUSD H1, M10 and Month1. Three moving averages, timeframe labels and the separator were visible. The invalid M1/M1 combination correctly triggered a clear warning. The interface works well, although low contrast and compressed detail candles can affect readability, especially on higher timeframes.
October 2, 2026
keeping M1 detail inside H1 context is a useful comparison view, with optional previous OHLC references and a clear requirement for the detail period to remain smaller than the larger candle.

Preguntas frecuentes

Chart UI Tools
Key Levels
Liquidity Sweep
CHOCH
Inducement
Market Structure
Liquidity Grab
Los productos disponibles a través de cTrader Store, incluidos bots, indicadores y plugins para operar, son proporcionados por desarrolladores de terceros y están disponibles únicamente con fines informativos y de acceso técnico. cTrader Store no es un bróker, por lo que no proporciona asesoramiento de inversión, recomendaciones personales ni ninguna garantía de rentabilidad futura.

Más de este autor

Indicador
BOS
CHOCH
+5
Spot market structure shift with ease, overlay timeframes, avoid false breakouts with open close pivots, hide chart bars
Indicador
Volume
Imbalance
+5
Spot Institutional Order Flow with Proportional Volume Bubbles & Integrated Cumulative Volume Delta (CVD) Intelligence.
Indicador
Forex
EURUSD
+5
Fimathe Indicator - Fimathe PCM - Automated Trend Channels & Levels — Ideal for live trading and backteting
Logotipo de "ZigXRay"
Mejor valorado
4.6
(5)
$29
/
$49
Indicador
CHOCH
Key Levels
+5
ZigZag Market Structure Identifier - Multi-Layer Scanner: Convergent Pivot Detection, 4-TF Overlay & Naked Chart Mode.
Plugin de escritorio
Risk/Reward
Trade Journal
+5
cTrader Journal - Automatic Trade Capture. Offline Reviews. No Subscription.
Logotipo de "DrbcLevels"
Mejor valorado
4.0
(4)
$19
/
$29
Indicador
Key Levels
Break & Retest
+5
Premium Discount Levels - Professional Dealing Range Zones with Draggable Lines, Alerts, Wartermark & Backtest Mode.
cBot
Fixed Lot
TP Manager
+5
Hotkeys Trading Assistant - Professional Shortcut Assitant with Risk Manager, Hotkeys & Lot Sizing.
Logotipo de "fvg_levels"
Mejor valorado
4.0
(4)
$19
/
$29
Indicador
Key Levels
Order Block
+5
FVG Levels — Auto-Detection of Multi-Timeframe Fair Value Gaps & GAPs, Smart Filters and Liquidity Zone Monitoring

Puede interesarle

Indicador
AI
BOS
+4
Golden Boom and Crash Spike Detector is a trading tool designed for Crash 300 and Boom 300 indices on M1 Timeframe.
Indicador
BOS
MSS
+5
WinSMC is an overlay SMC indicator for cTrader. It helps you visually identify!
Indicador
RSI
Forex
+4
😎Read the description before purchasing💩
Indicador
Fair Value Gap
Liquidity Grab
+2
PRO Liquidity Sweep + FVG Combo detector with custom Gold/Blue signals & alerts
Indicador
ATR
Wedge
+2
Strong Supertrend Turn Market Movement into a Clear Map Market analysis
Indicador
ATR
EMA
+3
The UTBot you know from TradingView — now on cTrader with confirmed signals, VWAP, EMA and session overlays.
Indicador
ATR
Forex
+5
A powerful ATR-based indicator generating clear BUY/SELL signals. Features real-time alerts and customizable sensitivity
Indicador
BOS
MSS
+3
Orderblocks with Multi-Timeframe.
Indicador
ATR
Volume
+3
Volume profile key levels - POC, value area, volume peaks and troughs - with break, rejection and retest signals
Indicador
AI
ATR
+27
Market Cipher B
Indicador
Auto Fibonacci Retracement Indicator for cTrader
Indicador
AI
ATR
+27
Overbought Oversold Indicator
Indicador
ATR
BTCUSD
+5
Multi-pole Gaussian filter channel with dynamic color, Reduced Lag & Fast Response modes. Port of DonovanWall's original
Indicador
ATR
Forex
+11
Elliott Wave 2 indicator with Markov probability analysis and a confidence score to assess Wave 3 continuation quality.
Indicador
Boost your trading with Candlestick Patterns for cTrader – auto-detect key signals for smarter, faster decisions!
Indicador
Prop
Forex
+4
Pivot Points Standard — All-in-One Multi-Timeframe Pivot Indicator for cTrader
Indicador
ATR
RSI
+3
🚀 Specialized algorithm is designed to confirm entry and exit points with precision 🎯
Indicador
MACD
Crypto
A simple tool to control market sessions. fixed the display on the weekend.

Precio

Desde 09/02/2026
29
Ventas
179
Instalaciones gratis