
Scalper Signal MTF
Indicador
253 transferências
Versão 1.0, Aug 2025
Windows, Mac
Descrição
Visão geral
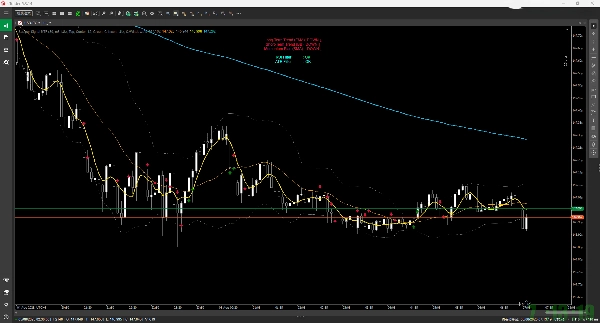
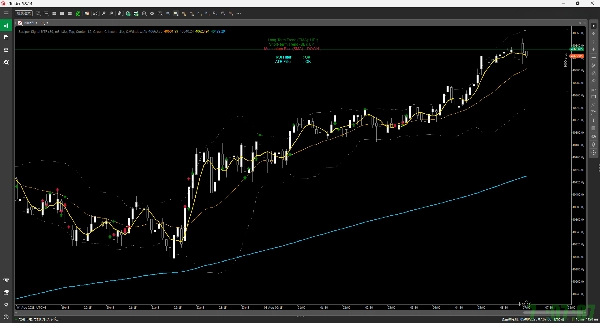
Com base em indicadores técnicos de um período de tempo especificado (por exemplo, 5 minutos), exibe sinais de compra/venda (setas) no gráfico atual. Também simula negociações após o aparecimento de um sinal e plota uma marca (uma estrela) no ponto potencial de saída.
Principais Características
- Exibição de Sinal de Compra/Venda:
-
- Sinal de Compra (Seta para Cima): Baseado em um cruzamento dourado da SMA (Média Móvel Simples), combinado com condições do RSI, EMA 200 e Bandas de Bollinger para identificar oportunidades favoráveis de compra.
- Sinal de Venda (Seta para Baixo): Baseado em um cruzamento morto da SMA, combinado com condições do RSI, EMA 200 e Bandas de Bollinger para identificar oportunidades favoráveis de venda.
- Simulação de Negociação:
-
- Após um sinal, assume-se que uma negociação é encerrada se qualquer uma das seguintes condições for atendida, e marca o gráfico com um ícone de estrela:
-
- Take Profit / Stop Loss (baseado no ATR e em uma relação Risco:Retorno especificada).
- Toque nas Bandas de Bollinger (bandas superior/inferior ou a linha do meio).
- Exceder o tempo máximo de manutenção.
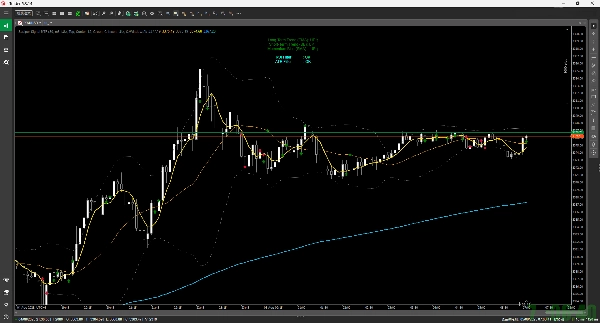
- Stops de breakeven e trailing também são calculados internamente.
- Exibição do Painel:
-
- Exibe um resumo simples do ambiente atual do mercado no canto superior esquerdo do gráfico, incluindo a tendência de longo prazo (EMA), tendência de curto prazo (BB) e momentum (SMA).
- Função de Alerta:
-
- Fornece uma notificação sonora quando um novo sinal é gerado.
Parâmetros
Você pode personalizar livremente os seguintes itens nas configurações do indicador:
- O período de tempo usado para cálculos (MTF).
- Os períodos para os vários indicadores (SMA, RSI, BB, EMA).
- Regras de saída de negociação (por exemplo, relação Risco:Retorno, tempo máximo de manutenção).
- Configurações de exibição para sinais e painel (visibilidade, cores, tamanho).
Resumo
Resumo de IA
Scalper Signal MTF is a custom indicator designed for the cTrader platform that provides multi-timeframe scalping signals. It analyzes technical indicators from a chosen timeframe—such as 5 minutes—and displays buy (up arrow) and sell (down arrow) signals on the current chart. Buy signals are generated based on an SMA golden cross combined with RSI, 200 EMA, and Bollinger Bands conditions; sell signals use an SMA dead cross with similar criteria.
The indicator simulates trades after signals appear and marks potential exit points with a star icon. Trade exits are triggered by take profit or stop loss levels (calculated using ATR and a specified risk-reward ratio), touching Bollinger Bands, exceeding maximum holding time, or internal breakeven and trailing stop calculations.
A dashboard on the chart’s top-left summarizes the current market environment, showing long-term trend (EMA), short-term trend (Bollinger Bands), and momentum (SMA). The indicator also provides sound alerts when new signals occur.
Users can customize the timeframe for calculations, indicator periods (SMA, RSI, BB, EMA), trade exit rules, and display settings including signal and dashboard visibility, colors, and sizes.
Perfil do indicador
Avaliações de clientes
0.0
Avaliações: 0
Avaliações de clientes
Ainda não há avaliações para este produto. Já o experimentou? Seja o primeiro a contar a outras pessoas!
Conversa
Perguntas frequentes
Os produtos disponíveis através da cTrader Store, incluindo bots de negociação, indicadores e plugins, são fornecidos por programadores terceiros e são disponibilizados apenas para fins informativos e de acesso técnico. A cTrader Store não é um corretor e não fornece aconselhamento em matéria de investimento, recomendações pessoais ou qualquer garantia de desempenho no futuro.
Mais deste autor


Preço
1
Vendas
1.34K
Instalações gratuitas