
ScalperSignalVisual
Indicateur
191 téléchargements
Version 1.0, Aug 2025
Windows, Mac
Description
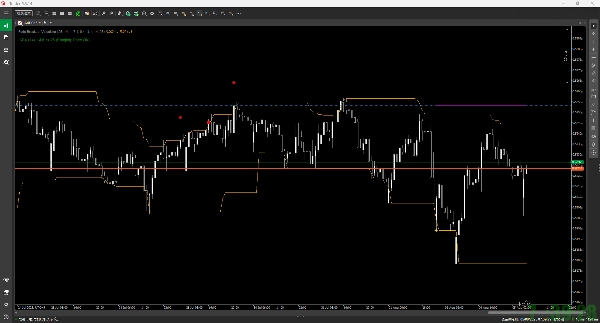
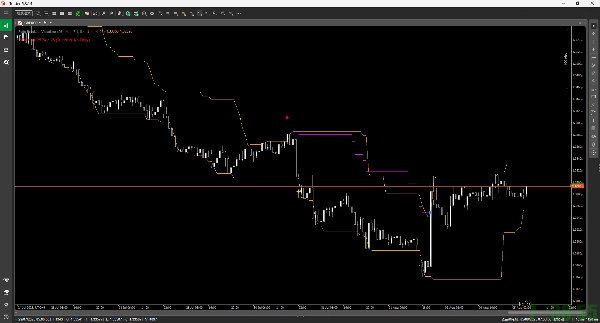
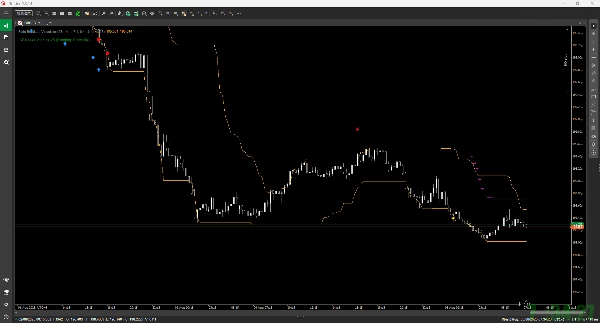
Cet indicateur est un outil pour visualiser la logique de trading d'une stratégie contrarienne appelée "Fade Breakout" sur votre graphique. Il n'effectue pas de transactions réelles mais montre comment une position serait gérée de l'entrée à la sortie lorsqu'un signal se produit.
Fonctionnalités clés
- Signaux d'entrée :
-
- Il utilise le Canal Donchian.
- Signal d'achat (contrarien) : Lorsque le prix casse à la baisse sous la bande inférieure du Canal Donchian, il affiche un signal d'achat (flèche bleue vers le haut ↑).
- Signal de vente (contrarien) : Lorsque le prix casse à la hausse au-dessus de la bande supérieure du Canal Donchian, il affiche un signal de vente (flèche rouge vers le bas ↓).
- Gestion des risques :
-
- À l'entrée, un Stop Loss initial (ligne rouge pointillée) et un premier Take Profit (ligne verte pointillée) sont tracés, basés sur le ATR (Average True Range).
- Lorsque le premier Take Profit (TP1) est atteint, une étoile dorée (★) apparaît, et le stop loss est déplacé au prix d'entrée (point mort).
- Ensuite, un Trailing Stop basé sur l'ATR s'active pour sécuriser les profits en suivant le prix. Le chemin du trailing stop est affiché sous forme de ligne magenta.
- Sorties de trade :
-
- Stop Loss : Si le prix atteint le niveau de stop loss, il est marqué par un carré rouge (■).
- Sortie Trailing Stop : Si le prix atteint le trailing stop, il est marqué par un carré bleu (■).
- Filtre ADX :
-
- Vous pouvez activer optionnellement le filtre ADX.
- Si l'ADX est supérieur à une valeur spécifiée (indiquant une forte tendance), il désactivera les nouveaux signaux d'entrée. Le statut actuel (Entrée OK / Pas d'entrée) est affiché dans le texte en haut à gauche du graphique.
Résumé
Profil de l'indicateur
Avis clients
0.0
Avis : 0
Avis clients
Il n'y a pas encore d'avis sur ce produit. Vous l'avez déjà essayé ? Soyez le premier à en parler aux autres !
Discussion
Questions fréquentes
Les produits disponibles sur cTrader Store, notamment les bots de trading, les indicateurs et les plug-ins, sont fournis par des développeurs tiers et mis à disposition à titre informatif et à des fins d'accès technique uniquement. cTrader Store n'est pas un courtier et ne fournit aucun conseil en investissement, aucune recommandation personnelle ni aucune garantie quant aux performances futures.
Plus de cet auteur


Prix
1
Ventes
1.34K
Installations gratuites