Description
ANALYSE TECHNIQUE, AVEC ALERTE SONORE
L'indicateur ANALYSE TECHNIQUE est une solution avancée d'analyse technique développée pour la plateforme cAlgo, intégrant plusieurs indicateurs techniques axés sur l'identification de tendances robustes, le momentum du marché et la confirmation du volume. Il combine l'ADX (Average Directional Index) avec une analyse de pente, un filtrage du volume et une analyse technique multi-indicateurs en temps réel, offrant aux traders une vue complète et fiable pour la prise de décision.
🔍 Stratégie Principale
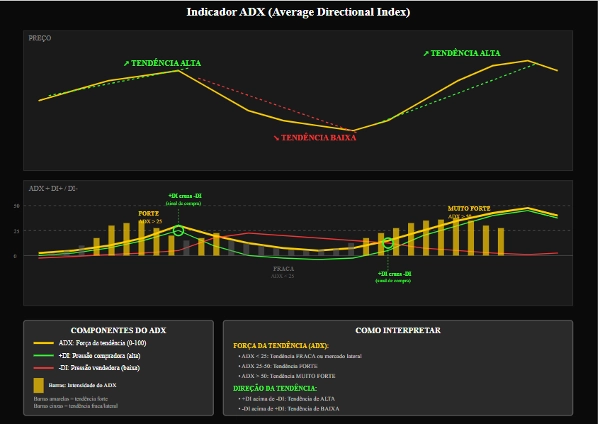
1. Base : ADX + DI (Système de Mouvement Directionnel)
Le cœur de l'indicateur est l'ADX (Average Directional Index), qui mesure la force de la tendance.
Les composants +DI (Indicateur Directionnel Positif) et -DI (Indicateur Directionnel Négatif) identifient la direction de la tendance :
+DI > -DI → Tendance haussière
-DI > +DI → Tendance baissière
2. Analyse Dynamique du Momentum avec la Pente
La pente de l'ADX, +DI et -DI est calculée à l'aide de la régression linéaire.
Cela permet d'identifier si la tendance :
Gagne en force (pente positive)
Perd de la force (pente négative)
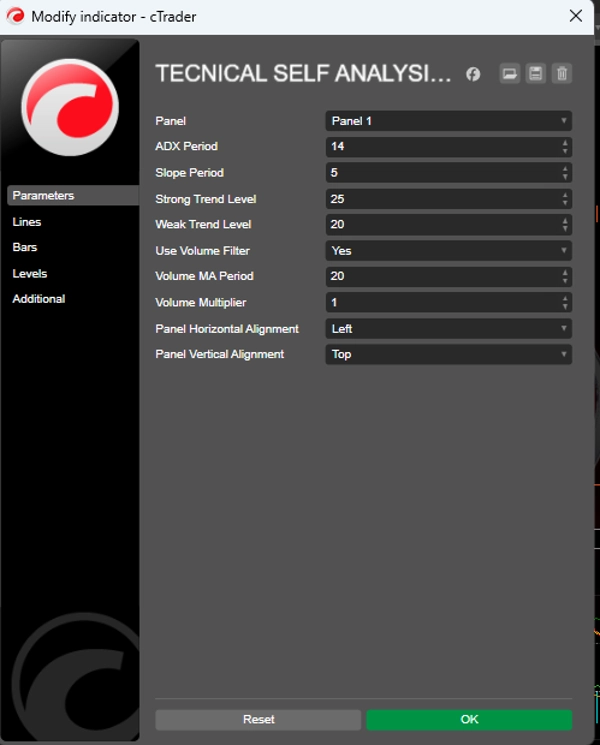
3. Niveaux de Référence
Niveau de Tendance Forte : Niveau au-dessus duquel la tendance est considérée comme forte (par défaut : 25)
Niveau de Tendance Faible : Niveau minimum pour considérer une tendance valide (par défaut : 20)
Les tendances en dessous du niveau faible sont considérées comme latérales ou sans direction claire.
📈 Génération de Signaux
Conditions d'Achat
✅ +DI croisant au-dessus de -DI
✅ ADX au-dessus du niveau de tendance faible (Niveau de Tendance Faible)
✅ Pentes positives de l'ADX et du +DI
✅ Confirmation du volume (optionnelle)
Conditions de Vente
✅ -DI croisant au-dessus de +DI
✅ ADX au-dessus du niveau de tendance faible (Niveau de Tendance Faible)
✅ Pentes positives de l'ADX et du -DI
✅ Confirmation du volume (optionnelle)
Signaux Forts : Lorsque l'ADX est au-dessus du Niveau de Tendance Forte et que les pentes sont significativement positives, l'indicateur génère des signaux renforcés, évitant les entrées répétées consécutives. 📊 Filtre de Volume (Optionnel)
L'indicateur peut nécessiter une confirmation du volume avant de générer des signaux.
Le volume actuel doit être supérieur ou égal à la moyenne mobile du volume × multiplicateur.
Cela aide à filtrer les faux cassures et signaux sur les marchés peu liquides.
🧠 Analyse Technique Avancée (Panneau Interactif)
ANALYSE TECHNIQUE comprend deux panneaux interactifs sur le graphique :
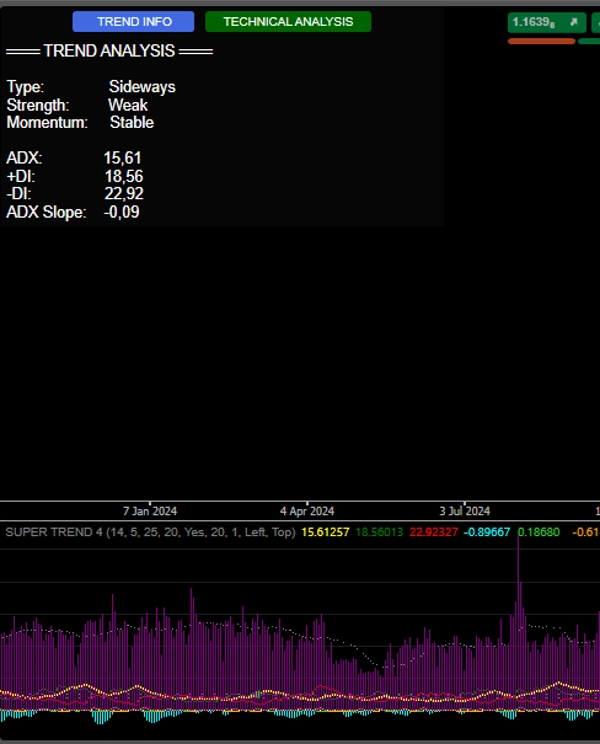
1. INFO TENDANCE
Type de Tendance : Tendance haussière / Tendance baissière / Latérale
Force de la Tendance : Forte / Faible
Momentum : Renforcement / Affaiblissement / Stable
Valeurs actuelles de l'ADX, +DI, -DI et de la Pente
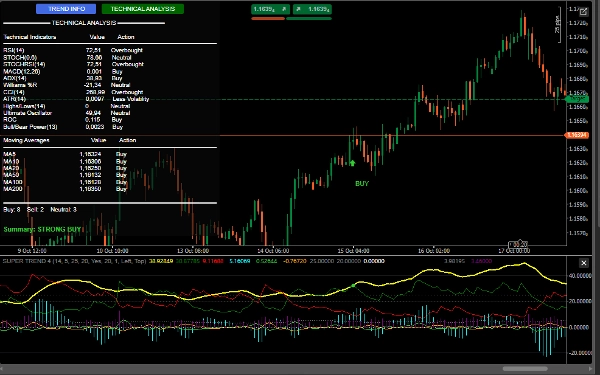
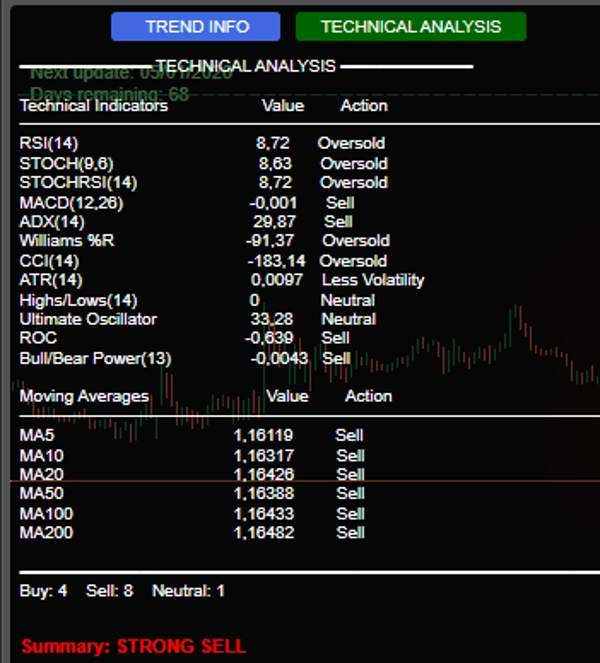
2. ANALYSE TECHNIQUE
Effectue une analyse multi-indicateurs en temps réel, incluant :
RSI(14) – Surachat/Survente
Stochastique(14) – Momentum
MACD(12,26) – Croisements et divergences
Williams %R – Extrêmes du marché
CCI(14) – Déviations par rapport au prix typique
ROC(12) – Taux de variation
Oscillateur Ultime – Confirmation de la force
Puissance Bull/Bear – Pression d'achat/vente
Moyennes Mobiles (5,10,20,50,100,200) – Tendance à long terme
Résumé Final : Le système compte les signaux d'achat/vente/neutres et émet une recommandation claire :
ACHAT FORT (≥7 signaux d'achat)
ACHAT
VENTE
VENTE FORTE (≥7 signaux de vente)
NEUTRE
🔔 Alertes et Visualisation
Signaux visuels sur le graphique :
Flèches vertes/rouges avec étiquettes "BUY"/"SELL"
Notifications sonores (Windows)
Journaux détaillés dans la console avec :
Heure du signal
Valeurs ADX, DI et volume (si activé)
🛡️ Avantages Concurrentiels
✅ Intégration de plusieurs indicateurs dans un seul tableau de bord
✅ Concentration sur la force et la direction de la tendance (pas seulement le prix)
✅ Filtre de volume pour une plus grande fiabilité
✅ Interface interactive et informative
✅ Signaux clairs avec alertes visuelles et sonores


![Logo de "High-Low Divergence [Iridio Capital]"](https://cdn.ctrader.com/image/webp/443c4661-7abb-40f1-842f-4b6ec560649b_40914)


